说明
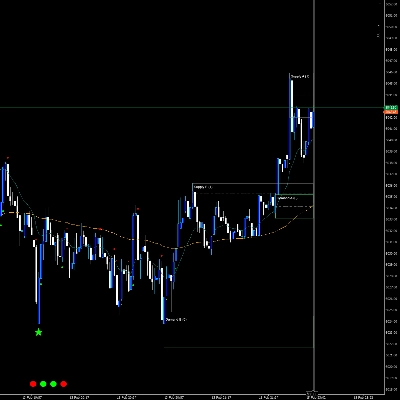
一个紧凑的cTrader剥头皮指标,将三种功能整合在一个简洁的叠加层中:基于交易时段的每日VWAP、开盘区间指南、“delta/能量”气泡作为动量/活动标记,以及带有测试/确认状态和可选趋势过滤器的动态供需区。此外,它还包括一个多时间框架的交通灯,能够一目了然地显示多个时间框架中最近关闭的蜡烛的方向(VWAP + 开盘区间)。
注意:参数设计得很灵活,方便您快速适应不同市场/时间框架;逻辑会自动在后台运行。
您将获得的功能
- 每日VWAP(每天交易日重置):可视化公平的“交易时段价格”,有助于均值回归、回撤和方向偏好
- 开盘区间(OR)高/低点:绘制开盘区间,方便您构建突破/反转策略(自动或手动定义分钟数)
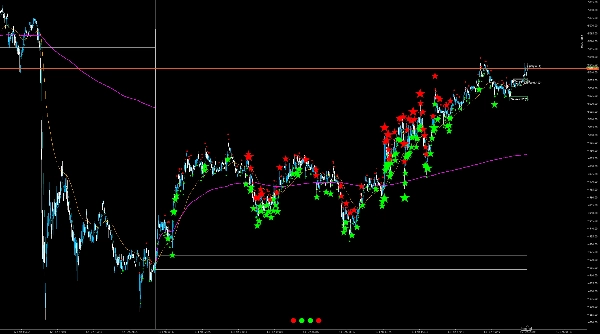
- Delta/能量气泡:突出显示活动量高于平均水平的蜡烛(根据模式:成交量激增、区间/实体成交量或delta代理),并按方向(看涨/看跌)着色
- 供需区(两个枢轴集A/B):自动生成的区间基于确认的枢轴高点/低点,带有基于ATR的区间深度、定义的右侧延伸和可选中线
- 区间状态:“新鲜 → 测试 → 确认”(确认可选通过成交量条件),让您立即了解区间是否已被交易以及是否有强烈反应
- 趋势过滤器(可选):EMA或EMA+ADX过滤器,仅在趋势方向显示/考虑区间(例如,仅在上升趋势中显示需求区)
- 多时间框架交通灯:显示M1/M5/H1/D1为绿/红/灰,取决于最后关闭的蜡烛——无需切换图表时间框架即可获得有用的上下文
买家可配置内容(参数概览)
设置分组且实用:
核心
- ATR长度:区间深度和部分气泡指标的基础输入
- 显示每日VWAP:开/关
- 显示开盘区间:开/关
- OR模式:自动(取决于图表时间框架)或手动(固定分钟数)
- OR自动因子 / OR分钟数:微调开盘区间持续时间
趋势过滤器
- 模式:关闭 / EMA / EMA+ADX
- EMA快线 / EMA慢线:通过EMA交叉/关系确定趋势方向
- ADX长度 + 阈值:启用EMA+ADX时的最小趋势强度
- 绘制EMA线:可选在图表上显示过滤EMA
气泡
- 显示气泡:开/关
- Delta代理:三种变体(区间加权、收盘价与前一根比较、收盘价与开盘价比较),取决于工具/数据源
- 气泡指标:自动或固定指标(绝对delta、成交量激增、实体/区间成交量)
- 分位回溯 + 分位百分比:控制气泡信号的“稀有度”(百分比越高=仅显示更强事件)
- 标签限制:图表上保留的气泡标签数量(性能/清晰度)
- 基础字体 + 4K模式:高分辨率显示的视觉缩放
- 符号小/大:气泡形状(点/圆等)
- 调试:强制显示气泡(仅测试用)
区间
- 显示区间:开/关
- 区间深度 × ATR:区间厚度(适应波动性)
- 延伸(柱数):区间向右延伸的距离
- 显示中线:开/关
- 仅显示趋势内区间:仅当趋势过滤器方向匹配时显示区间
- 枢轴参数A & B(左/右):两种灵敏度(例如,“粗略”+“精细”区间)
- 区间标签大小:小/中/大
- 颜色(ARGB):供需、测试、确认及中线的独立颜色
- 通过成交量 + 成交量均线/乘数确认:仅当成交量高于均线×因子时确认
交通灯
- 显示交通灯:开/关
- 字体 + 4K缩放:大小/可读性
- 每N根柱更新:更新频率(性能与响应性权衡)
(参数字段描述可以通过参数属性/描述清晰呈现;平台支持在参数UI中直接分组和描述。)
适用人群
- 需要快速获取市场背景的剥头皮和日内交易者:VWAP/开盘区间用于结构,气泡表示“活动”,区间表示反应区域
- 希望清晰可视化而不堆叠多个指标的交易者
- 希望可选趋势过滤视图(EMA/ADX),同时保持核心为即插即用显示的用户
典型用法(简短实用)
通过VWAP + 交通灯检查偏向,并在开盘阶段将开盘区间作为“战斗区”。
使用气泡作为“这里发生了某些超出平均水平的活动”(突破、吸收、冲击)的线索。
将区间用作规划区域:首次触及=“测试”;高成交量反应可标记为“确认”;中线有助于清晰的级别间交易。
摘要
指标配置
客户评价
0.0
评价:0
客户评价
该产品尚无评价。已经试过了?抢先告诉其他人!
讨论
常见问答
Prop
Forex
Signal
Breakout
Scalping
Indices
Commodities
Crypto
Stocks
cTrader Store 提供的所有产品,包括交易机器人、指标和插件,均由第三方开发者提供,仅供信息参考和技术访问之用。cTrader Store 并非经纪商,不提供投资建议、个人推荐或任何未来业绩保证。
该作者的其他作品


价格
注册日期 10/01/2026
6
销售