
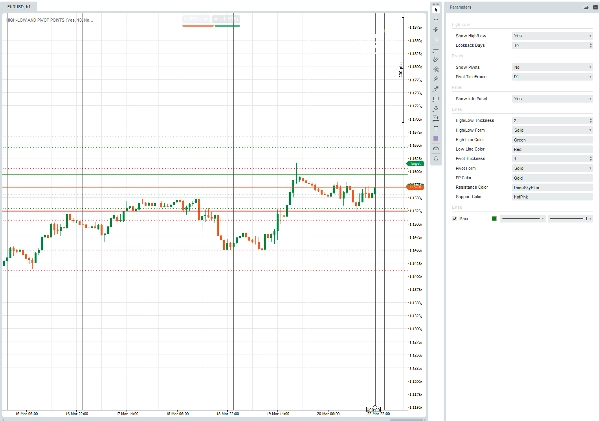
PIVOT POINTS, HIGH-LOW OF THE DAY
指标
108 下载
版本 1.0, Mar 2026
Windows 版、Mac 版
说明
高低点和枢轴点 是一个cTrader叠加指标,直接在您的图表上绘制每日高/低价格水平和经典枢轴点。
参数一览:
组别 您可以控制的内容
高低点
显示/隐藏线条;显示多少过去的天数(回溯天数)
枢轴点
显示/隐藏线条;哪个时间框架驱动枢轴计算(日线、周线等)
面板
显示/隐藏图表上的信息框,列出当前价格和枢轴水平
线条
高点、低点、PP、阻力位和支撑线的粗细、样式(实线/点线/非常点线)和颜色
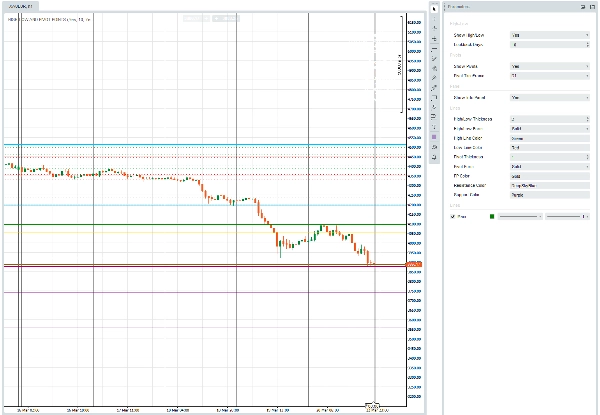
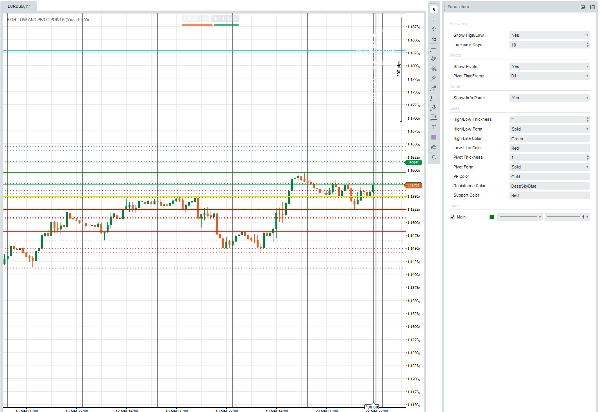
它绘制的内容:
- 以您选择的颜色显示今日高/低点;过去回溯天数以较浅/较细的相同颜色显示。
- 七个标准枢轴水平 — PP, R1–R3, S1–S3 — 从您选择的枢轴时间框架的前一个完成的柱子计算得出。
- 右上角信息面板总结了实时的日高/低、多日回溯范围以及所有七个枢轴价格。
摘要
AI 摘要
The "Pivot Points, High-Low of the Day" indicator for cTrader overlays daily high and low price levels along with classic pivot points directly on trading charts. It visually displays today's high and low prices, as well as those from prior days based on a configurable lookback period. The indicator calculates and plots seven standard pivot levels—Pivot Point (PP), Resistance levels R1 to R3, and Support levels S1 to S3—derived from the previous completed bar of a selectable timeframe (e.g., daily or weekly). Users can customize visibility, line thickness, style (solid, dotted, very dotted), and colors for all lines including high, low, pivot, resistance, and support. An optional on-chart info panel summarizes live day high/low, multi-day range, and all pivot prices for quick reference. This tool supports multiple markets and symbols including Forex pairs (EURUSD, GBPUSD, NZDUSD, USDJPY), cryptocurrencies (BTCUSD), commodities (XAUUSD), indices (NAS100), and stocks. It is designed to assist traders in identifying key price levels and potential breakout or reversal points based on historical price data and pivot calculations.
指标配置
客户评价
0.0
评价:0
客户评价
该产品尚无评价。已经试过了?抢先告诉其他人!
讨论
常见问答
BTCUSD
Forex
Breakout
Indices
EURUSD
Commodities
GBPUSD
NZDUSD
Crypto
Stocks
XAUUSD
NAS100
USDJPY
cTrader Store 提供的所有产品,包括交易机器人、指标和插件,均由第三方开发者提供,仅供信息参考和技术访问之用。cTrader Store 并非经纪商,不提供投资建议、个人推荐或任何未来业绩保证。
该作者的其他作品


价格
49
销售
306
免费安装