说明
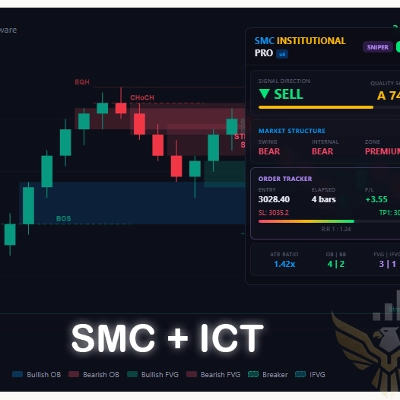
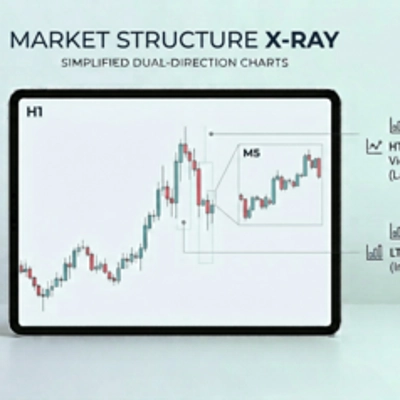
市场结构X光
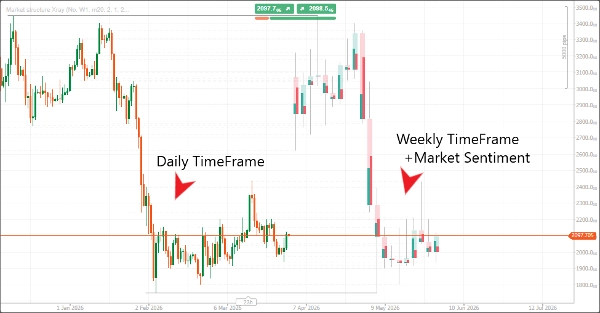
无需切换时间框架即可查看完整的市场结构
大多数交易者亏损并不是因为他们的策略错误。
他们亏损是因为交易时信息不完整。
你查看更高时间框架的偏向,切换到较低时间框架进行入场,却失去了上下文。
你看到蜡烛图形成,但看不到它们内部发生了什么。
你进入看似干净的交易,却被你未完全看到的结构所否定。
你并没有错。你只是没有看到完整的画面。
此工具的功能
市场结构X光让你在单一图表内直接获得真正的多时间框架可视性。
- 将更高时间框架的蜡烛图投影到当前图表上
- 将较低时间框架的活动压缩成更高时间框架的结构
- 揭示每根蜡烛内部的多头和空头情绪
无需切换。无需猜测。无需盲目执行。
这将带来哪些改变
- 在较低时间框架执行交易时获得更高时间框架的确认
- 在失败前识别弱势走势
- 了解每根蜡烛内部的形成过程
- 做出更快、更自信的交易决策
核心功能
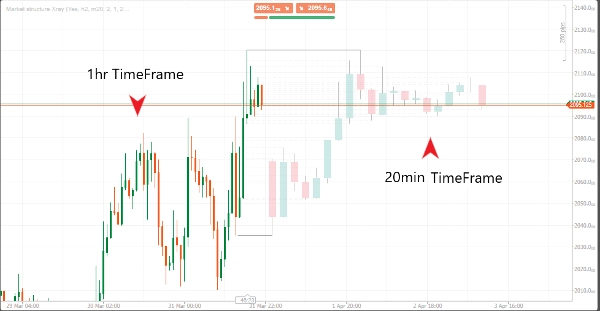
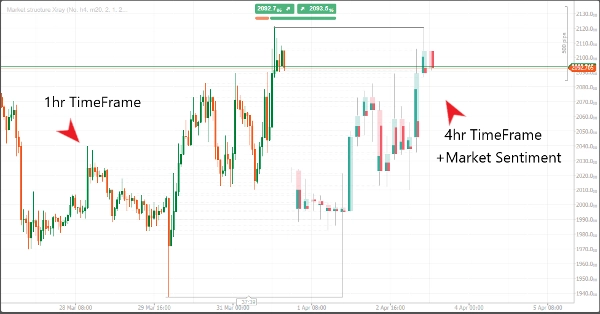
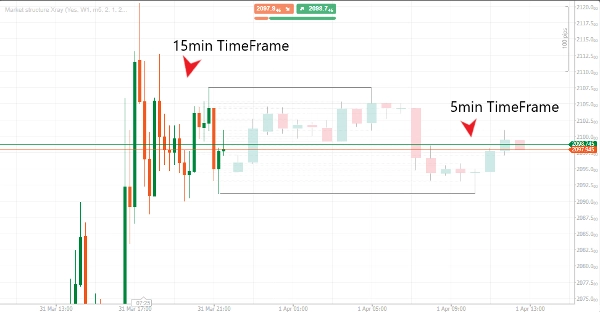
更高时间框架投影
直接在当前图表上查看更高时间框架的蜡烛图形成。
无需离开执行时间框架即可保持与结构的一致。
较低时间框架压缩
观察较低时间框架的价格动作如何构建每根更高时间框架的蜡烛图。
理解每次走势背后的真实故事。
内部情绪可视化
每根蜡烛显示多头和空头压力之间的平衡。
不仅仅是开盘和收盘——而是内部发生了什么。
前瞻性投影显示
投影的蜡烛图显示在当前价格之前,帮助你规划和预判结构。
简洁的视觉设计
极简的覆盖设计,提升清晰度而不使图表杂乱。
适用人群
- 使用ICT或SMC概念的交易者
- 需要更高时间框架偏向的短线交易者
- 厌倦在图表间切换的日内交易者
- 专注于结构而非信号的交易者
不适用人群
- 寻找自动买卖信号的新手
- 不理解市场结构的交易者
- 期望完全自动化系统的任何人
你将获得
- 市场结构X光指标
- 交易清晰度手册
- 图表设置模板
- 执行模型指南
- 终身更新
最终观点
你不需要更多的指标。
你需要更好的价格可视性。
此工具让你能够以大多数交易者无法做到的方式跨时间框架观察结构。
这种差异正是随机执行与受控决策之间的区别。
摘要
指标配置
指标分类
趋势
输出类型
可视化
数据要求
跳动点数据
客户评价
4.0
评价:3
5 | 0 % | |
4 | 100 % | |
3 | 0 % | |
2 | 0 % | |
1 | 0 % |
客户评价
April 8, 2026
Is easier to judge after expectations are normal. It can help with chart reading, but the trader still needs to know why the entry makes sense.
April 5, 2026
not a full strategy, but it has a clear role. It helps with chart reading, while the weak spot is that price action still needs to agree. Better rechecked it on 3 sessions.
April 2, 2026
If this produced around 4 percent ROI in a month with DD under 3 percent, That feels like that a good first sign, not proof of a holy grail. The first run should stay small enough to be boring.
讨论
常见问答
Prop
Forex
Indices
Commodities
Crypto
Stocks
cTrader Store 提供的所有产品,包括交易机器人、指标和插件,均由第三方开发者提供,仅供信息参考和技术访问之用。cTrader Store 并非经纪商,不提供投资建议、个人推荐或任何未来业绩保证。