说明
━━━━━━━━━━━━━━━━━━━━━━━━━━━━━━━━━━━━━━━━
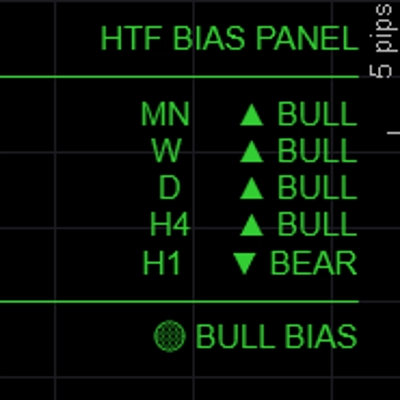
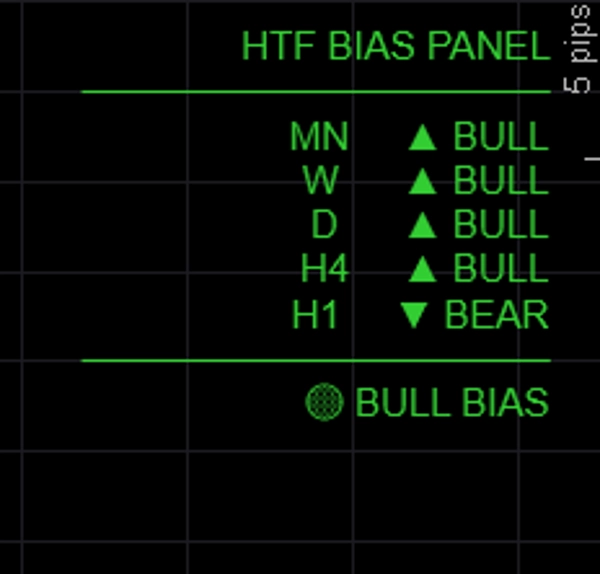
HTF 偏差面板 — 偏差
━━━━━━━━━━━━━━━━━━━━━━━━━━━━━━━━━━━━━━━━
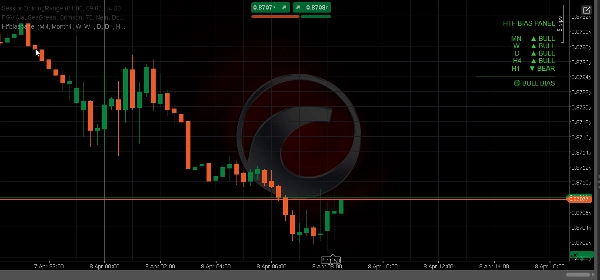
在一个干净的图表面板中同时显示最多五个时间框架的方向偏差——这样您在进入交易前总能知道更高时间框架是看涨、看跌还是混合状态。
─────────────────────────────
主要特点
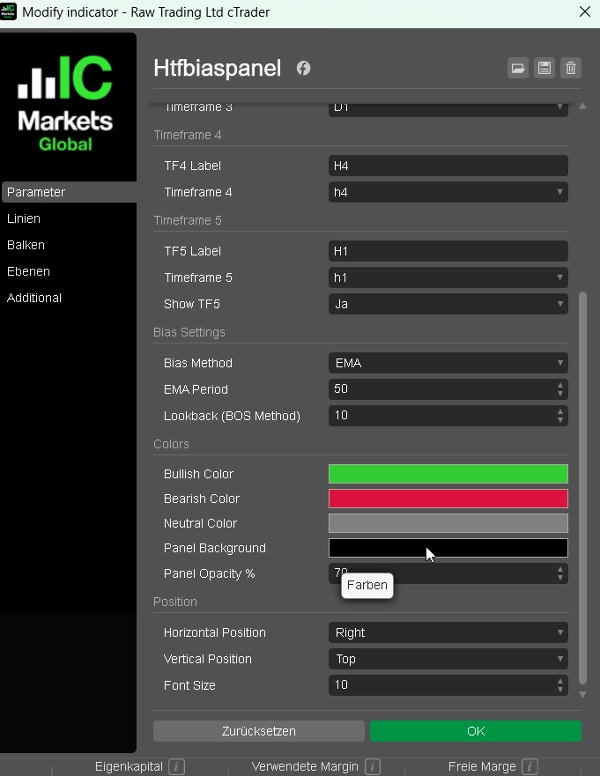
► 5 个完全可配置的时间框架 — 默认 MN / W / D / H4 / H1,所有标签和时间框架均可自定义
► 三种偏差方法 — 选择每个时段确定偏差的方法:
• EMA:收盘价高于/低于 EMA(50) → 趋势跟踪中最可靠
• 价格与上次收盘价比较:当前收盘价与前一收盘价比较 → 反应迅速,基于动量
• BOS:最近区间与之前区间比较 → 基于结构的偏差
► 对齐总结 — 面板底部显示完全看涨 / 完全看跌 / 看涨偏差 / 看跌偏差 / 中性
► 颜色编码输出 — 绿色表示看涨,红色表示看跌,灰色表示中性
► 面板位置 — 可放置于左上、右上、顶部中央、左下或右下
► 看涨、看跌和中性状态的颜色完全可自定义
► 轻量级 — 无图表绘制,无矩形,无额外负担
─────────────────────────────
偏差方法说明
→ EMA(默认):如果收盘价 > EMA(周期),则看涨。最稳定,忽略短期噪音。
→ 价格与上次收盘价比较:如果当前柱收盘价 > 前一柱收盘价,则看涨。快速且反应灵敏。
→ BOS:比较最近 N 根柱的区间与之前 N 根柱的区间。如果高点更高且低点更高,则看涨。
─────────────────────────────
默认设置
→ 时间框架1 月线 (MN)
→ 时间框架2 周线 (W)
→ 时间框架3 日线 (D)
→ 时间框架4 4小时线 (H4)
→ 时间框架5 1小时线 (H1,可切换)
→ 偏差方法 EMA
→ EMA 周期 50
→ 看涨颜色 LimeGreen
→ 看跌颜色 Crimson
→ 位置 左上角
─────────────────────────────
使用方法
1. 将面板添加到任意图表
2. 选择您偏好的偏差方法(初学者推荐 EMA)
3. 进入交易前检查对齐总结 — 仅当显示看涨偏差或完全看涨时做多
4. 使用 HTF 偏差过滤您的 BOS/CHoCH 或 FVG 指标信号 — 仅按面板确认的方向交易
5. 调整时间框架以匹配您的交易风格(例如,剥头皮者使用 D / H4 / H1 / M15 / M5)
─────────────────────────────
适用对象
✔ 需要快速自上而下分析的 ICT 和智能资金概念交易者
✔ 需要快速视觉偏差检查的多时间框架交易者
✔ 需要合流交易的 FTMO 和自营交易公司交易者
✔ 想避免逆高时间框架趋势交易的任何交易者
✔ 外汇、黄金、指数和加密货币差价合约交易者
─────────────────────────────
兼容性
→ 平台 cTrader(桌面版和网页版)
→ 资产类别 外汇、指数、商品、加密货币差价合约
→ 时间框架 全部(M1 到 MN)
→ 访问权限 无需权限
→ 账户类型 实盘和模拟
━━━━━━━━━━━━━━━━━━━━━━━━━━━━━━━━━━━━━━━━
摘要
客户评价
5 | 75 % | |
4 | 25 % | |
3 | 0 % | |
2 | 0 % | |
1 | 0 % |