


Mô tả
📉 SMARTZIG — TRÌNH HIỂN THỊ CẤU TRÚC THỊ TRƯỜNG TỐI ƯU (PHIÊN BẢN 🇧🇷 GIẢM)
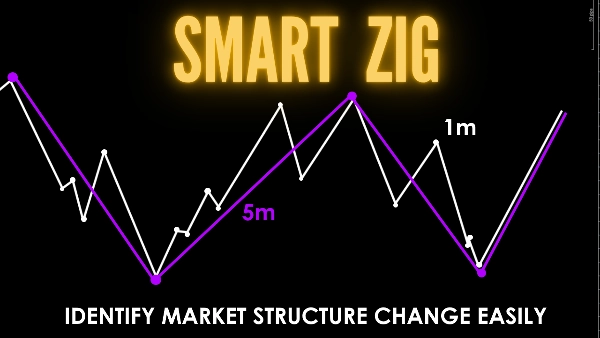
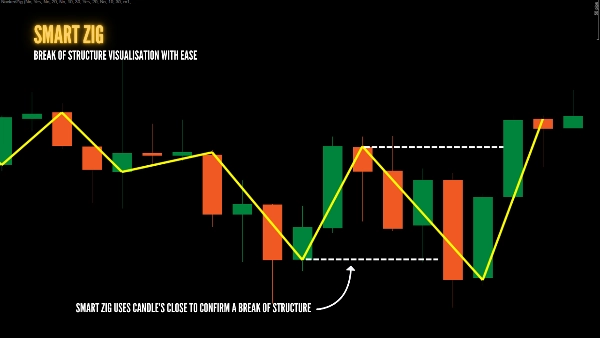
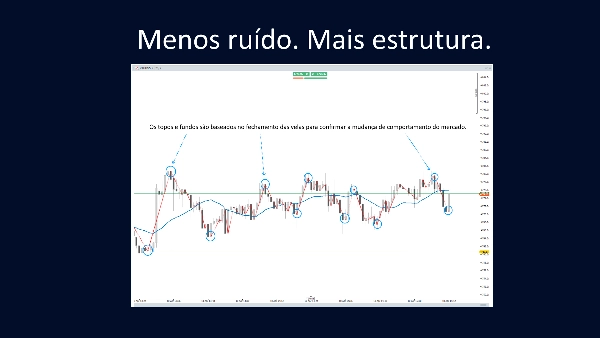
Đọc hành động giá như một chuyên gia. SmartZig loại bỏ nhiễu bấc bằng cách lập bản đồ cấu trúc trực tiếp từ thân nến (mở và đóng). Tránh các phá vỡ giả bằng cách chồng các dao động Khung Thời Gian Thấp (LTF) lên Khung Thời Gian Cao (HTF) cùng lúc để dễ dàng phát hiện sự thay đổi cấu trúc thị trường và trạng thái giao hàng (CISD), nhận xác nhận hành động giá và quét thanh khoản dựa trên mở đóng thay vì bấc. Ẩn các thanh biểu đồ để rõ ràng hơn khi thực hiện phân tích kỹ thuật của bạn.
✅ TẠI SAO NÂNG CẤP LÊN SMARTZIG?
- Động cơ Zigzag Đôi: Chạy hai ZigZag độc lập để xem xu hướng nhanh và chậm cùng lúc.
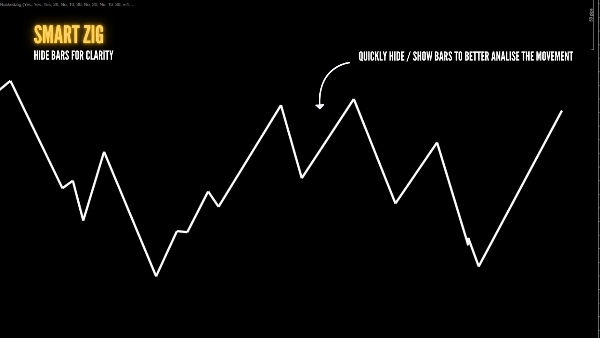
- Chế độ Biểu đồ Trần: Ẩn tất cả các thanh nến chỉ với một cú nhấp để tập trung hoàn toàn vào khung xương ZigZag.
- Độ chính xác dựa trên Thân nến: Các điểm xoay được lấy từ mức Mở/Đóng, tránh các phá vỡ bấc giả.
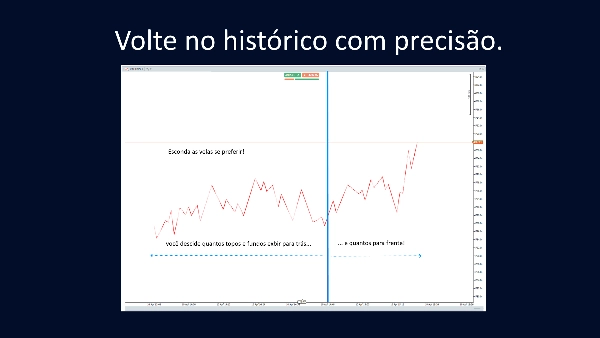
- Lịch sử Tương tác: Kéo mỏ neo dọc để ngay lập tức hiển thị các chân cấu trúc trong bất kỳ phiên nào trước đó.
- Khung Thời Gian Độc lập: Đặt các khoảng thời gian nguồn khác nhau cho LTF và HTF mà không cần chuyển đổi biểu đồ.
- Thực thi Sạch sẽ: Ngừng vẽ thủ công và để chỉ báo cập nhật dao động của bạn theo thời gian thực.
📺 XEM HƯỚNG DẪN & THAM GIA CỘNG ĐỒNG:
(Vui lòng đăng câu hỏi/yêu cầu hỗ trợ của bạn trong phần bình luận video để giúp cộng đồng của chúng ta phát triển!)
🛠️ TÍNH NĂNG CHÍNH:
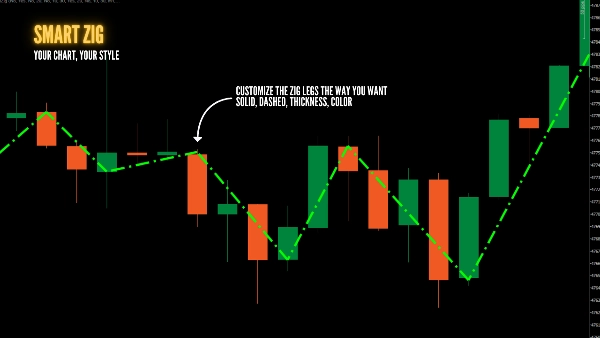
- Kiểu dáng Tùy chỉnh: Màu sắc, độ dày và kiểu đường riêng biệt cho mỗi ZigZag.
- Lọc Chân: Chọn chính xác số chân lịch sử bạn muốn xem.
- Mỏ neo Kéo được: Di chuyển tiêu điểm nghiên cứu đến bất kỳ thanh lịch sử nào bằng chuột của bạn.
- Chuyển đổi Hiển thị Toàn bộ: Ẩn hoặc hiện toàn bộ nghiên cứu ngay lập tức để làm gọn màn hình của bạn.
🇧🇷 SMARTZIG — TRÌNH HIỂN THỊ CẤU TRÚC THỊ TRƯỜNG TỐI ƯU
Phân tích hành động giá (Price Action) như một chuyên gia. SmartZig loại bỏ nhiễu bấc bằng cách lập bản đồ cấu trúc trực tiếp từ thân nến (mở và đóng). Tránh các phá vỡ giả bằng cách chồng các dao động Khung Thời Gian Thấp (LTF) lên Khung Thời Gian Cao (HTF) cùng lúc để dễ dàng phát hiện sự thay đổi cấu trúc thị trường và trạng thái giao hàng (CISD). Nhận xác nhận hành động giá và quét thanh khoản dựa trên mở đóng thay vì bấc. Ẩn các thanh biểu đồ để rõ ràng hơn khi thực hiện phân tích kỹ thuật của bạn.
✅ TẠI SAO NÂNG CẤP LÊN SMARTZIG?
- ZigZag Đôi: Chạy hai ZigZag độc lập để xem xu hướng nhanh và chậm cùng lúc.
- Chế độ Biểu đồ Sạch: Ẩn tất cả các nến chỉ với một cú nhấp và tập trung hoàn toàn vào "khung xương" thị trường.
- Độ chính xác dựa trên Thân nến: Các điểm xoay được lấy từ Mở/Đóng, tránh các phá vỡ bấc giả.
- Tương tác Lịch sử: Kéo mỏ neo dọc để hiển thị các chân cấu trúc trong bất kỳ phiên nào trước đó.
- Khung Thời Gian Độc lập: Đặt các khoảng thời gian nguồn khác nhau cho LTF và HTF mà không cần chuyển đổi biểu đồ.
- Thực thi Nhanh: Ngừng vẽ dao động thủ công; để chỉ báo cập nhật cấu trúc theo thời gian thực.
📺 XEM HƯỚNG DẪN VÀ GIẢI ĐÁP THẮC MẮC:
(Vui lòng đăng câu hỏi và yêu cầu hỗ trợ của bạn trong phần bình luận video trên để giúp nhiều người nhất có thể!)
🛠️ ĐIỂM NỔI BẬT KỸ THUẬT:
- Kiểu dáng Tùy chỉnh: Màu sắc, độ dày và kiểu đường riêng biệt cho mỗi ZigZag.
- Lọc Chân: Chọn chính xác số chân lịch sử bạn muốn xem.
- Mỏ neo Kéo được: Di chuyển tiêu điểm nghiên cứu đến bất kỳ thanh lịch sử nào bằng chuột của bạn.
- Chuyển đổi Hiển thị Toàn bộ: Ẩn hoặc hiện toàn bộ nghiên cứu ngay lập tức để làm gọn màn hình của bạn.
Tóm tắt
Key features include a dual ZigZag engine that tracks fast and slow trends independently, customizable styling for colors and line thickness, and interactive history with draggable vertical anchors to explore past structural legs. It supports independent timeframe settings for LTF and HTF without switching charts and updates swings in real-time, eliminating the need for manual drawing. Additional functionalities include leg filtering to control the number of visible historical legs and a full visibility toggle to declutter the chart.
SmartZig is tagged for key levels, break of structure (BOS), liquidity sweeps and grabs, change of character (CHOCH), market structure, and support/resistance analysis. It provides a visual tool for technical analysts to read price action more accurately and confirm liquidity events based on open-close pivots. A tutorial video is available for user guidance.
Đánh giá của khách hàng
Thảo luận
Câu hỏi thường gặp






















Giá