
说明
WeTrades 高成交量支撑/阻力区间
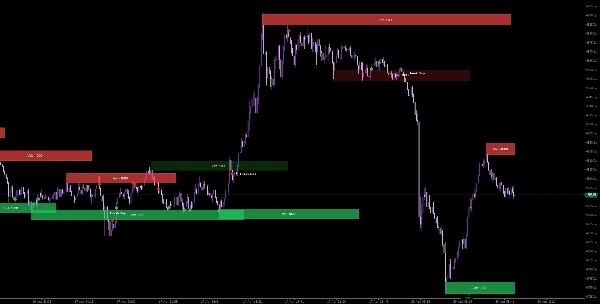
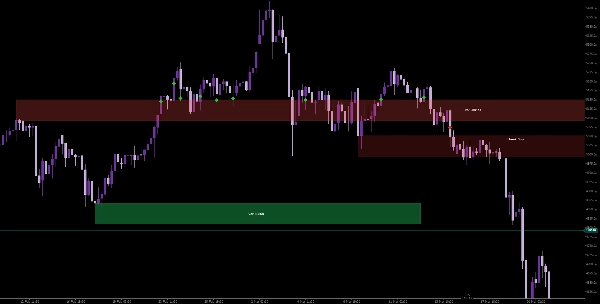
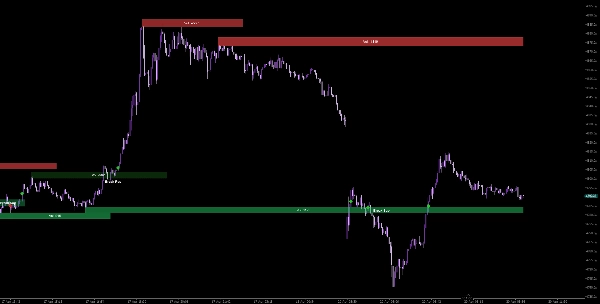
WeTrades 高成交量支撑/阻力区间 是一个先进的支撑和阻力指标,基于 高成交量活动和市场结构 突出显示关键价格区域。
该工具不是使用传统的线条,而是将 动态支撑和阻力区域以盒子形式可视化,让您更清晰地了解强劲买卖压力所在。
基于受 ChartPrime 概念启发的成交量驱动逻辑构建,该指标帮助交易者精准识别 高概率反应区、突破和流动性变化。
主要特点
基于高成交量的支撑/阻力区
自动检测结合成交量强度的枢轴收盘价支撑和阻力。
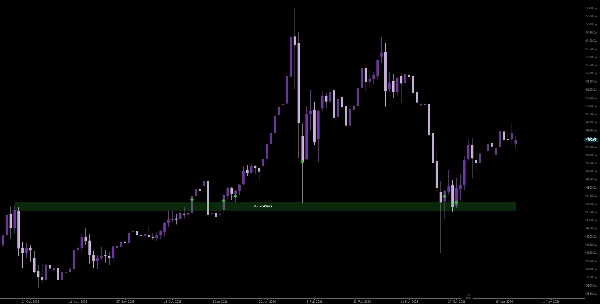
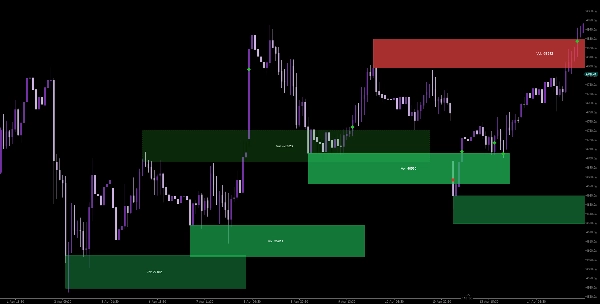
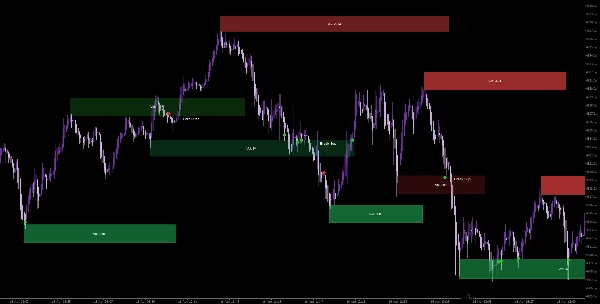
动态盒子可视化
以自适应盒子显示区域,随价格扩展,使结构比静态线条更易读。
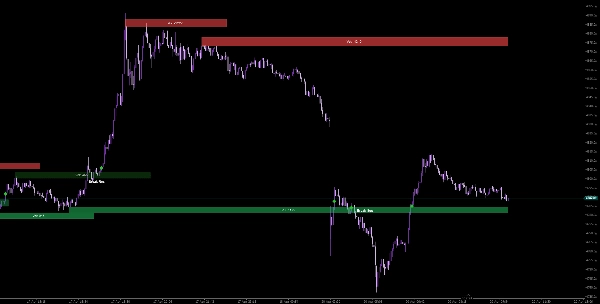
基于ATR的区间宽度
根据市场波动调整盒子大小,提供更真实和响应迅速的水平。
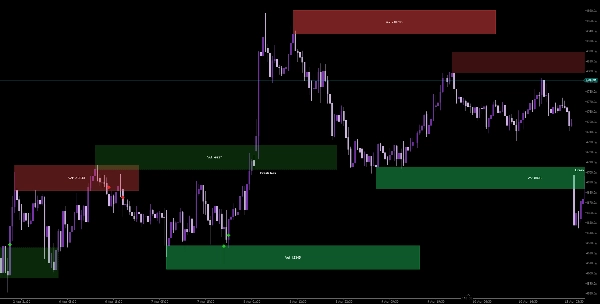
成交量强度标签
每个区域包含成交量标签,帮助您快速识别强弱水平。
突破与持稳信号
- 检测支撑/阻力是否持稳
- 突出显示突破事件
- 追踪角色反转(支撑 ↔ 阻力转换)
智能成交量过滤
使用成交量差值窗口过滤弱区域,仅关注有意义的活动。
它如何帮助您的交易
- 识别 强劲的积累和分配区域
- 发现 高概率反转区域
- 交易 带成交量确认的突破
- 清晰理解 市场结构变化
- 提升 入场时机和信心
最佳使用场景
- 智能资金概念 (SMC)
- 供需交易
- 突破和回测策略
- 基于成交量的交易系统
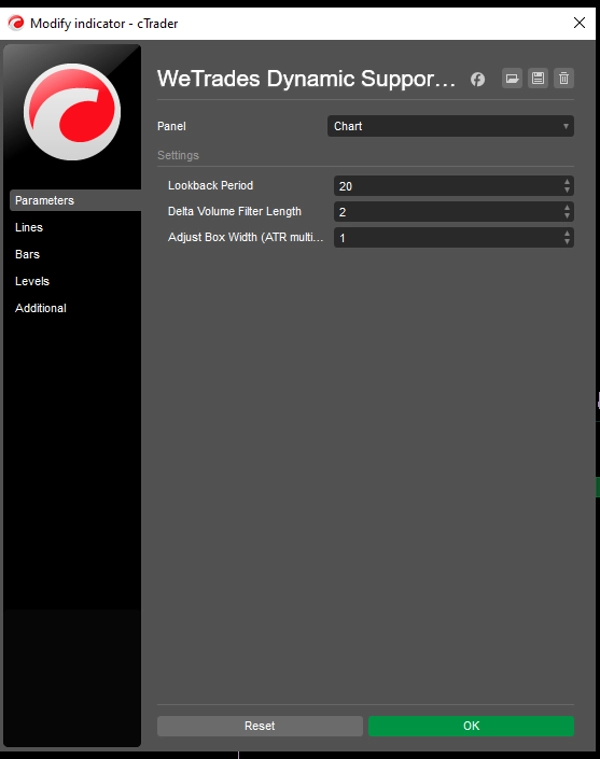
参数
- 回溯周期 – 控制枢轴灵敏度
- 成交量差值过滤长度 – 过滤弱区域
- 盒子宽度 (ATR 乘数) – 调整区域大小
摘要
AI 摘要
WeTrades Dynamic Support Resistance is a volume-based indicator that identifies key support and resistance zones as dynamic boxes rather than static lines. It uses pivot closes combined with volume strength to detect high-volume price areas, adapting box width based on market volatility via ATR (Average True Range). Each zone is labeled with volume strength to distinguish strong from weak levels. The indicator provides breakout, hold, and role reversal (support-resistance flip) signals to highlight market structure shifts and liquidity changes. It filters out weak zones using a delta volume window, focusing on meaningful market activity. Designed to assist traders in spotting accumulation and distribution zones, high-probability reversals, and volume-confirmed breakouts, it supports strategies such as Smart Money Concepts, Supply & Demand trading, and breakout-retest approaches. Key adjustable parameters include lookback period for pivot sensitivity, delta volume filter length, and ATR multiplier for box sizing. The indicator outputs visualizations of support and resistance zones and signals for breakout and reversal events, aiding in clearer market structure interpretation and improved trade entry timing.
指标配置
指标分类
支撑与阻力
输出类型
可视化
数据要求
仅 K 线
支持的信号
突破
反转
趋势强度
波动性
触及水平位
突破水平位
客户评价
0.0
评价:0
客户评价
该产品尚无评价。已经试过了?抢先告诉其他人!
讨论
常见问答
Key Levels
MSS
Volume
Market Structure
Supply & Demand
ATR
Support & Resistance
cTrader Store 提供的所有产品,包括交易机器人、指标和插件,均由第三方开发者提供,仅供信息参考和技术访问之用。cTrader Store 并非经纪商,不提供投资建议、个人推荐或任何未来业绩保证。
该作者的其他作品


价格
2.59K
免费安装