

ICT First Presented FVG
Gösterge
234 i̇ndirmeler
Sürüm 1.1, Apr 2026
Windows, Mac
3.98K
Ücretsiz yüklemeler
Açıklama
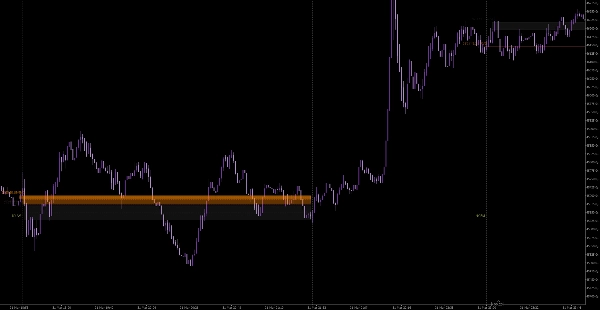
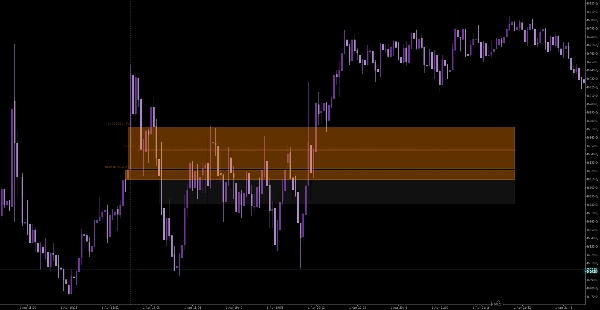
Bu, tek bir "çapa" noktasına odaklanan özel bir BİT tabanlı göstergedir: saat 9:30 New York Borsası açılışı.
İşte doğrudan konuya giren özet:
🎯 Birincil İşlev
Gösterge, 9:30 açılışına kadar tüm fiyat hareketlerini görmezden gelir. Piyasa açıldıktan sonra, ortaya çıkan ilk Adil Değer Boşluğu (FVG) için arama yapar. BİT teorisinde, bu ilk boşluk genellikle sabah oturumunun yönü için "kurumsal ayak izi" olarak kabul edilir.
🛠️ Temel Özellikler
- Otomatik Arama: 1 dakikalık veya 5 dakikalık grafiği kendiniz taramanıza gerek yok; zil çaldıktan hemen sonra ilk geçerli dengesizliği vurgular.
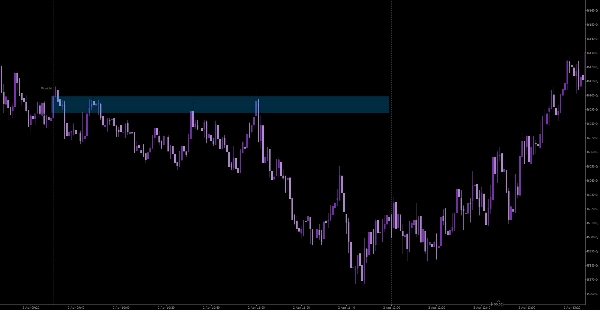
- Genişletilmiş Kutular: Mevcut fiyata kadar ileriye doğru bir kutu çizer. Bu, fiyatın günün ilerleyen saatlerinde o belirli sabah boşluğunu "test edip etmediğini" veya "doldurup doldurmadığını" görmenizi sağlar.
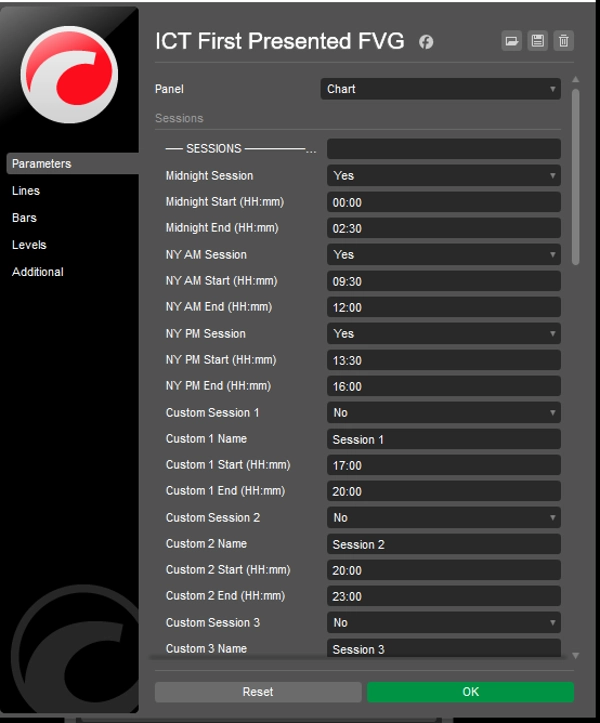
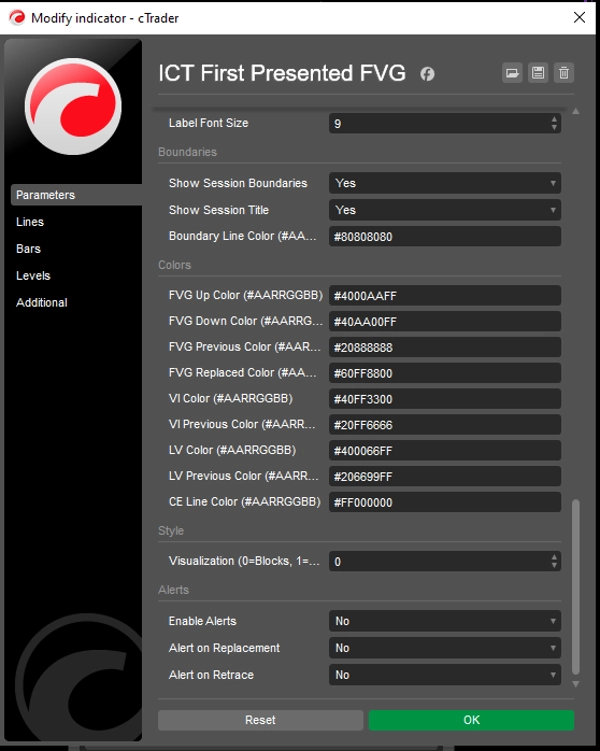
- Görsel Kontrol: Katı bloklar veya basit çizgiler arasında geçiş yapabilir ve renkleri grafik şablonunuza uyacak şekilde değiştirebilirsiniz.
- Desen Takibi: Tarih etiketleri ekler, böylece önceki günlere bakarak 9:30 FVG'nin destek veya direnç olarak ne sıklıkta korunduğunu görebilirsiniz.
💡 Daha iyi nasıl yapabilirsiniz
Bu araç "kurulumu" bulmak için harika olsa da, size "bağlamı" vermez. Kazanma oranınızı artırmak için:
- Daha Yüksek Zaman Dilimi Eğilimi: 9:30 açılışında sadece 1 saatlik veya 4 saatlik trendiniz zaten yükselişteyse "Uzun" FVG alın. Her "ilk FVG"yi körü körüne alırsanız, zarar edersiniz.
- "Judas Swing"i Bekleyin: Çoğu zaman, 9:30'daki ilk FVG bir tuzaktır (sahte hareket). İlk FVG başarısız olursa ve fiyat karşı yönde ikinci bir boşluk oluşturursa, genellikle günün gerçek hareketi budur.
- "Doldurma" Kuralı: Fiyat geri gelip 9:30 FVG'yi tamamen kapatırsa, kurumsal "gücü" kaybolur. Sadece fiyat kutunun kenarına dokunup oradan tepki verdiği işlemleri arayın.
Özet
AI summary
ICT First Presented FVG is a specialized trading indicator based on Inner Circle Trader (ICT) theory, designed to identify the first Fair Value Gap (FVG) that forms immediately after the 9:30 AM New York Stock Exchange open. This initial gap is considered a key institutional footprint indicating the morning session’s directional bias.
Key features include automated detection of the first valid imbalance after the market opens, eliminating the need for manual scanning of short-term charts. The indicator visually highlights this gap with an extended box projecting forward to the current price, allowing traders to monitor if and when the gap is retested or filled during the day. Users can customize the visual style with solid blocks or lines and adjust colors to match their chart templates. Additionally, date labels track past occurrences to analyze how often the 9:30 AM FVG acts as support or resistance.
The indicator supports markets including Forex, indices, commodities, stocks, and cryptocurrencies such as BTCUSD and EURUSD. It is intended to be used alongside higher timeframe trend analysis and price action context to improve trade decision-making, particularly by observing patterns like the "Judas Swing" and the behavior of price around the FVG fill level.
Key features include automated detection of the first valid imbalance after the market opens, eliminating the need for manual scanning of short-term charts. The indicator visually highlights this gap with an extended box projecting forward to the current price, allowing traders to monitor if and when the gap is retested or filled during the day. Users can customize the visual style with solid blocks or lines and adjust colors to match their chart templates. Additionally, date labels track past occurrences to analyze how often the 9:30 AM FVG acts as support or resistance.
The indicator supports markets including Forex, indices, commodities, stocks, and cryptocurrencies such as BTCUSD and EURUSD. It is intended to be used alongside higher timeframe trend analysis and price action context to improve trade decision-making, particularly by observing patterns like the "Judas Swing" and the behavior of price around the FVG fill level.
Gösterge profili
Müşteri değerlendirmeleri
0.0
Değerlendirmeler: 0
Müşteri değerlendirmeleri
Bu ürün için henüz bir değerlendirme yok. Ürünü denediniz mi? O zaman ona dair görüşlerini paylaşan ilk kişi olun!
Tartışma
SSS
BTCUSD
Forex
Signal
Breakout
Indices
EURUSD
Commodities
GBPUSD
NZDUSD
Martingale
Prop
Scalping
SMC
Crypto
Grid
Stocks
AI
XAUUSD
NAS100
USDJPY
cTrader Store üzerinden erişilebilen işlem botları, göstergeler ve eklentiler gibi ürünler, üçüncü taraf sağlayıcılar tarafından sağlanır ve yalnızca bilgilendirme ve teknik erişim amaçlarıyla sunulur. cTrader Store bir broker değildir ve yatırım tavsiyesi, kişisel öneriler vermez veya gelecekteki performansı garanti etmez.
Bu oluşturanın diğer ürünleri





















!["Smart Money Concepts (SMC) [Iridio Capital]" logosu](https://cdn.ctrader.com/image/webp/b4b5414d-a5ca-44b7-a947-e28eca44a218_61548)






Fiyat
3.98K
Ücretsiz yüklemeler