
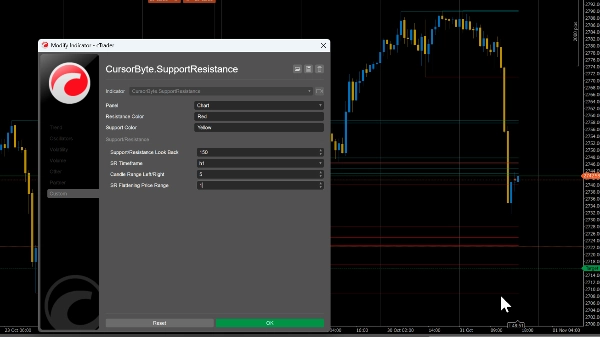
CursorByte.SupportResistance v3
Индикатор
292 скачивания
Версия 1.0, Mar 2025
Windows, Mac
5.0
Отзывы: 1
Описание
***Улучшенная версия***
https://ctrader.com/products/2113
***********************
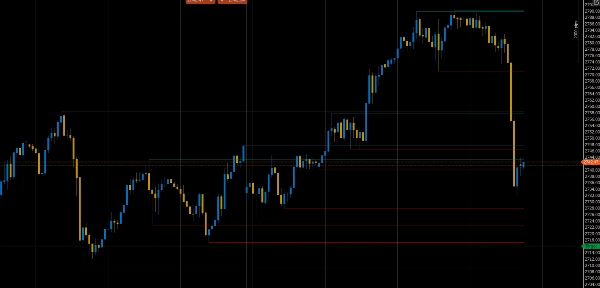
Вы можете установить диапазон сглаживания цены в зависимости от пары. Либо 0.0001 для таких пар, как GU, и 1.5 для золота.
Этот индикатор автоматически определяет ключевые уровни поддержки и сопротивления на графике, помогая трейдерам выявлять потенциальные зоны разворота, точки пробоя и области консолидации цены для более точного входа и выхода.
Примечание: используйте диапазон сглаживания цены, чтобы уменьшить загромождение на графике (консолидировать линии поддержки и сопротивления в пределах определённого ценового диапазона в одну).
Сводка
Профиль индикатора
Отзывы покупателей
5.0
Отзывы: 1
5 | 100 % | |
4 | 0 % | |
3 | 0 % | |
2 | 0 % | |
1 | 0 % |
Отзывы покупателей
August 12, 2025
Pros: Accurate auto SR levels, customizable design, stable performance. Cons: No significance filter, no auto-clear, possible chart clutter.
Обсуждение
Частые вопросы
Breakout
Commodities
XAUUSD
Продукты, доступные в cTrader Store, включая торговых ботов, индикаторы и плагины, предоставляются сторонними разработчиками и доступны исключительно в информационных и технических целях. cTrader Store не является брокером и не предоставляет инвестиционные консультации, персональные рекомендации или какие-либо гарантии будущей доходности.


![Логотип продукта "[Stellar Strategies] Market Session Ultimate"](https://cdn.ctrader.com/image/webp/61ffd537-0125-4246-9e72-42eca1791d64_28232)


![Логотип продукта "[Stellar Strategies] Visual Trend Momentum"](https://cdn.ctrader.com/image/webp/48aee0a5-f10e-4bc8-9671-78e156fcc5df_27548)
Цена
С 31/10/2024
56
Продажи
1.75K
Бесплатные установки