

Description
MTC INTERACTIV RAINBOW PRO
POURQUOI CE RAINBOW EST DIFFÉRENT
Les indicateurs Rainbow existent depuis des années, de belles bandes de moyennes mobiles sur le graphique. Le problème : presque personne ne sait vraiment comment les lire ou les transformer en décisions. Ils sont beaux… puis restent là, inutilisés.
MTC Interactiv Rainbow Pro corrige exactement cela, de manière interactive. Au lieu de fixer des dizaines de lignes colorées en devinant, vous travaillez AVEC le rainbow : survolez, cliquez, concentrez-vous, mesurez, et laissez le graphique s'expliquer lui-même.
CE QUE VOUS VOYEZ
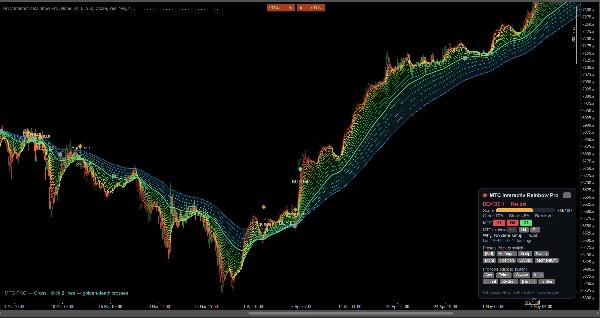
• Un rainbow EMA dense et lisse qui montre la direction, la force et le momentum de la tendance en un coup d'œil.
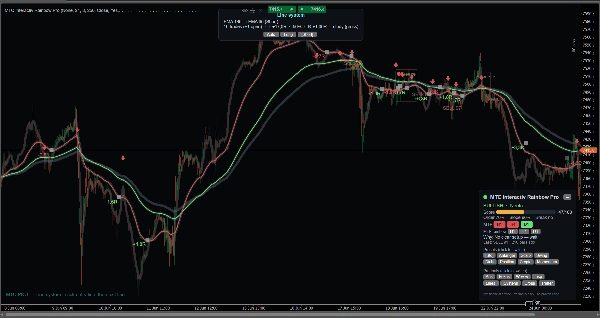
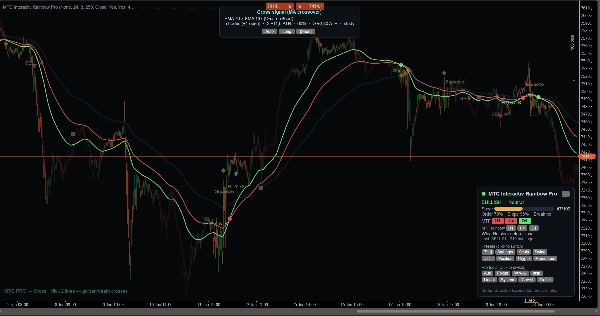
• Des marqueurs clairs ACHAT / VENTE / SORTIE et des zones de compression/rupture — tout sur des barres fermées, sans repaint.
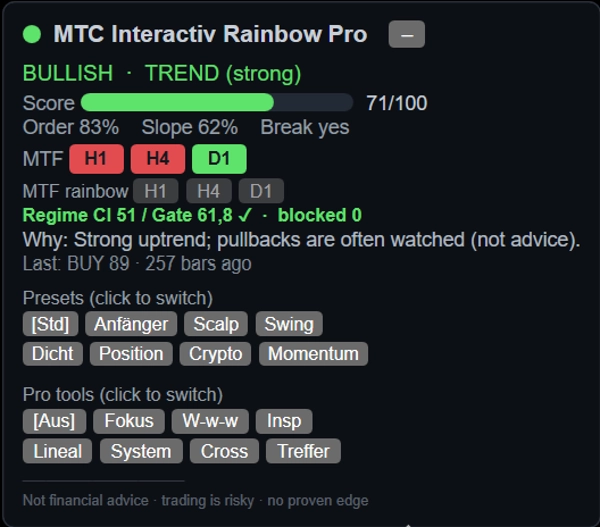
• Un tableau de bord compact en direct : direction, un score de force de 0 à 100, lectures d'ordre/pente/rupture, consensus multi-échelles, et un "pourquoi" en langage clair.
CE QUI LE REND INTERACTIF (la partie que personne d'autre ne vous donne)
• Survolez n'importe quelle ligne pour voir instantanément sa période EMA — enfin savoir quelle moyenne vous regardez.
• Concentrez-vous sur une seule ligne et estompez le reste pour une vue claire.
• Outils "Et si" et Inspection pour étudier n'importe quelle barre ou signal passé.
• Une règle intégrée (ATR / R / pips).
• Études Ligne-Système & Croisement pour explorer comment deux moyennes interagissent.
• Étude du taux de respect : à quelle fréquence le prix respecte réellement une ligne choisie.
• Superposition Rainbow MTF en un clic : voir le rainbow H1 / H4 / D1 sur votre graphique actuel en gris.
• 8 préréglages en un clic (Débutant, Scalping, Swing, Position, Crypto, Momentum, Dense, Standard).
• Filtre de régime optionnel et superposition de gestion des trades (stop structurel, bande de risque 1R, ligne de suivi) pour une gestion disciplinée du risque.
COMMENT LE LIRE
Éventé et ordonné = tendance forte. Serré ensemble = enroulement, une rupture est proche. Flèche haut/bas = signal de rupture. Plus la bande est dense et ordonnée, plus le mouvement est fort. Un tutoriel interactif intégré (anglais & allemand) vous guide pas à pas.
POUR QUI C'EST
• Les débutants qui ont toujours voulu utiliser un rainbow mais ne savaient pas comment — les outils interactifs vous enseignent au fur et à mesure.
• Les traders expérimentés qui veulent une lecture rapide et claire de la tendance, du momentum et du contexte multi-échelles.
• Les créateurs de bots : une base de recherche transparente pour vos propres stratégies et bots EMA / MA.
Fonctionne sur n'importe quel symbole et timeframe ; les outils interactifs brillent sur M5–H4. Pas de taille de compte minimum — c'est un outil d'analyse, pas un autotrader.
IMPORTANT — VEUILLEZ LIRE
Ceci est un outil d'analyse et d'apprentissage, PAS un conseil en investissement ni une garantie de profit. Tous les signaux, scores et trades simulés sont des observations, pas un avantage statistiquement prouvé. Le trading avec effet de levier est risqué et peut entraîner une perte totale. Prenez toujours vos propres décisions et testez d'abord sur un compte démo.
Résumé
Key features include an interactive interface allowing users to hover over lines to identify EMA periods, focus on individual lines, and use tools like "What-if" analysis, inspection of past signals, and a built-in ruler measuring ATR, price range, and pips. The indicator offers line-system and cross studies to analyze interactions between averages, a respect-rate study to assess price adherence to specific lines, and a one-click multi-timeframe rainbow overlay showing higher timeframe EMAs in grey.
A compact live dashboard provides a 0–100 strength score, order, slope, breakout readings, multi-timeframe consensus, and plain-language explanations. Eight one-click presets cater to various trading styles and markets, including scalp, swing, position, crypto, and momentum trading. Additional features include an optional regime filter and trade-management overlays for risk control.
Suitable for all symbols and timeframes, especially effective on M5 to H4 charts, this tool supports traders ranging from beginners learning to use EMA rainbows to experienced traders and bot developers seeking a transparent EMA research base.




















