

说明
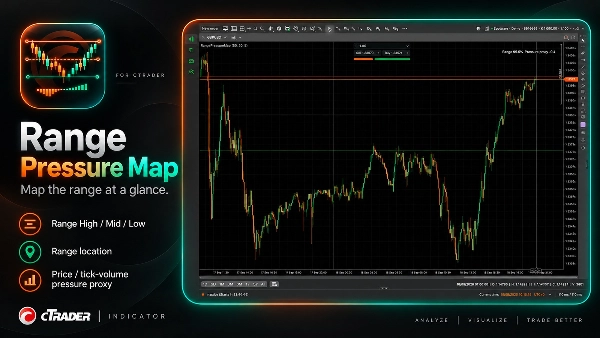
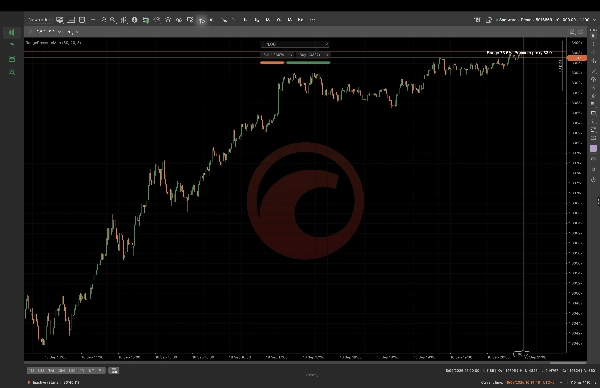
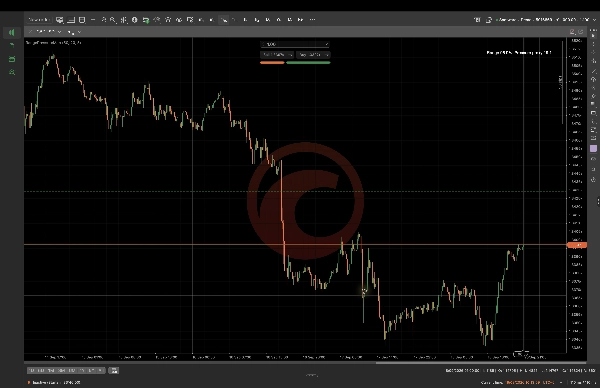
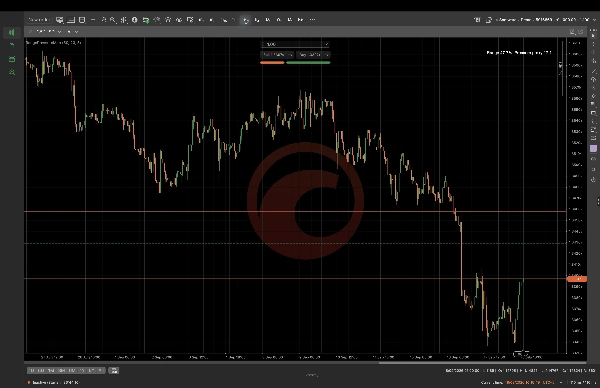
区间压力图计算回溯区间,并显示区间高点、区间中点和区间低点,以及当前价格位置和确定性的成交量压力代理。配置区间回溯、压力回溯和EMA长度以匹配您正在查看的图表上下文。它旨在用于自由裁量图表分析,不代表订单流、真实市场成交量、买方或卖方活动、预测或自动交易执行。数值取决于所选符号、时间框架、参数和可用数据。
摘要
AI summary
Range Pressure Map is a cTrader indicator that calculates a lookback range and visually displays the Range High, Range Mid, and Range Low levels on your chart. It also shows the current price location within this range alongside a deterministic tick-volume pressure proxy, which serves as an estimate of market pressure based on tick volume data. Users can customize parameters including range lookback period, pressure lookback, and EMA length to align with their specific chart context. This tool is intended for discretionary chart analysis and does not provide order flow data, real market volume, buyer or seller activity, predictive signals, or automated trade execution. Its outputs depend on the selected trading symbol, timeframe, and input parameters. The indicator supports visualization of support and resistance levels combined with volume-based pressure insights to assist traders in analyzing price action within defined ranges.
指标配置
指标分类
支撑与阻力
输出类型
可视化
数据要求
仅 K 线
客户评价
0.0
评价:0
客户评价
该产品尚无评价。已经试过了?抢先告诉其他人!
讨论
常见问答
EMA
Volume
cTrader Store 提供的所有产品,包括交易机器人、指标和插件,均由第三方开发者提供,仅供信息参考和技术访问之用。cTrader Store 并非经纪商,不提供投资建议、个人推荐或任何未来业绩保证。
该作者的其他作品




















价格
注册日期 16/09/2026