present
Inscrivez-vous et bénéficiez d'une remise de 50 $ sur votre premier achat
Trading product for MidasVolumeProfile Indicateur Key Levels Volume, image 1
MidasVolumeProfile
Indicateur
Version 1.3, Oct 2026
Windows, Mac
Trading product for MidasVolumeProfile Indicateur Key Levels Volume, image 2
Trading product for MidasVolumeProfile Indicateur Key Levels Volume, image 3
Trading product for MidasVolumeProfile Indicateur Key Levels Volume, image 4
Depuis le 27/09/2026

Description

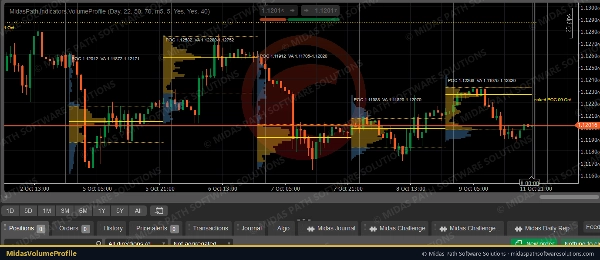
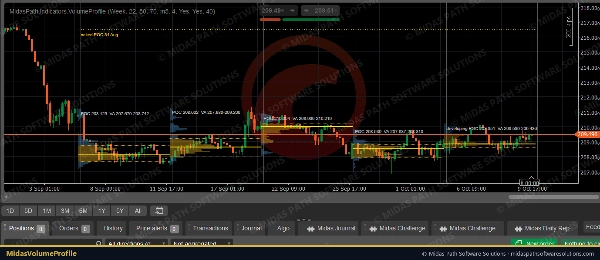
Midas Volume Profile shows where volume traded in each day or week, drawn as a histogram at the start of the session, with the levels profile traders use.


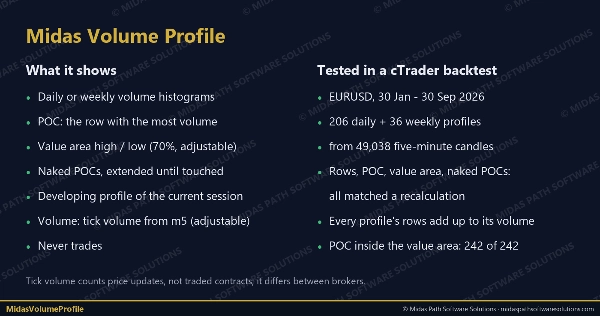
What it shows

• A volume histogram for each session, with the value area highlighted.

• POC (point of control): the price row with the most volume, drawn across the session.

• Value area high and low (VAH / VAL): the range around the POC that holds 70% of the session's volume (adjustable).

• Naked POCs: earlier sessions' POCs that price has not traded through since, extended to the right until price touches them.

• The developing profile of the current session, updated as each candle closes.


How it is built

• Volume is cTrader's tick volume (the number of price updates), the usual measure in forex and CFDs, where there is no central exchange volume. It is taken from a lower timeframe (5 minutes by default) for detail.

• Each candle's volume is shared across the price rows its high-low range covers, in proportion to the overlap. The session's range is split into 50 rows (adjustable).

• The value area grows from the POC towards whichever neighbouring row holds more volume, until it holds the chosen share.


Settings

• Profiles per day or per week, session start hour (22:00 UTC by default, the forex day), rows, value-area share, volume timeframe.

• Number of sessions shown, developing session on or off, naked POCs on or off, histogram width and colours.


Tested

• In a cTrader backtest on EURUSD (30 Jan-30 Sep 2026), all 206 daily and 36 weekly profiles built from 49,038 five-minute candles matched an independent recalculation: session boundaries, every row's volume (each profile's rows add up to its total volume), POC, value area and every naked-POC touch.

• On that data the POC sat inside the value area in every profile, the value area held 71% of volume on average (rows are whole, so it slightly exceeds 70%), and 10 daily and 2 weekly POCs were still naked at the end.


Notes

• Tick volume counts price changes, not traded contracts; it differs between brokers.

• Volume profiles describe where trading happened; they do not predict where price will go.

• It never trades and needs no internet or file access.

Résumé

Résumé IA
Midas Volume Profile is an indicator that visualizes session volume distribution using tick volume data, primarily for forex and CFD markets where centralized volume is unavailable. It displays a histogram of traded volume for each day or week at the session start, highlighting key levels used by volume profile traders.

Key features include:
- Point of Control (POC): the price level with the highest traded volume, extended across the session.
- Value Area High and Low (VAH/VAL): price range around the POC containing approximately 70% of the session’s volume, adjustable by the user.
- Naked POCs: POCs from previous sessions that price has not revisited, extended until touched.
- A developing profile for the current session, updated with each candle close.

The indicator calculates volume by distributing each candle’s tick volume proportionally across price rows within its high-low range, dividing the session range into adjustable rows (default 50). It supports profiles per day or week, customizable session start times, and visual settings such as histogram width and colors.

Midas Volume Profile operates without trading or internet access and has been tested for accuracy against independent recalculations on EURUSD data. It provides a detailed view of where trading activity concentrates but does not predict price direction.
Profil de l'indicateur
Catégorie de l'indicateur
Volume
Type de résultat
Visualisation
Exigences en matière de données
Barres seulement

Discussion

Avis clients

0.0
Avis : 0
Avis clients
Il n'y a pas encore d'avis sur ce produit. Vous l'avez déjà essayé ? Soyez le premier à en parler aux autres !

Questions fréquentes

Key Levels
Volume
Support & Resistance
Les produits disponibles sur cTrader Store, notamment les bots de trading, les indicateurs et les plug-ins, sont fournis par des développeurs tiers et mis à disposition à titre informatif et à des fins d'accès technique uniquement. cTrader Store n'est pas un courtier et ne fournit aucun conseil en investissement, aucune recommandation personnelle ni aucune garantie quant aux performances futures.

Plus de cet auteur
Plug-in desktop
File Access
Trade Journal
Your watchlist in one grid: trend on five timeframes, ADR used, correlation to the chart's symbol, currency strength.
Indicateur
Key Levels
Liquidity Grab
+2
The levels you mark each morning, drawn and followed: PDH/PDL, weekly, monthly, sessions, equal highs/lows.
cBot
Partial Close
Prop Firm Fit
Copies opens, closes, partial closes and SL/TP from one cTrader account to others on the same PC, with safe sizing.
Plug-in desktop
External Data
Study economic event reactions with broker M1 history, bar replay, range comparisons and a reproducible export.

Vous pourriez aussi aimer

Indicateur
Prop
Forex
+13
🎯Automatically detects and visualizes classical chart patterns using multi-timeframe swing point analysis.
Indicateur
ATR
BOS
+5
Opening ranges, dynamic trend channels, and multi-scale breakout/retest analysis for clear intraday chart decisions.
Indicateur
Block Liquidity,indicator.Block Order, Liquids Stops, Signal Sentiment,signal correctio.
Indicateur
AI
Prop
+14
Professional Trading Indicator Transform Your Trading with Intelligent Signal Detection RenkoProfit
Indicateur
AI
ATR
+26
MacD Custom Indicator-Multiple Time Frame
Indicateur
Supertrend
Moving Average
Easy Trade: Trend & Breakout Indicator for cTrader
Indicateur
Forex
GBPUSD
+5
Visual warning zones for high-impact news so you can manage risk before volatility hits.
Indicateur
AI-assisted
Order Block
+5
The daily bias estimator indicator uses ICT concepts to show whether the chart is bullish or bearish on multi-time frame
Indicateur
BOS
CHOCH
+5
A professional-grade cTrader indicator for traders following the Inner Circle Trader (ICT) methodology. It replaces 6–8
Indicateur
Volume
Liquidity Sweep
+1
Liquidity Profiler Tools
Indicateur
Volume
Support & Resistance
Compare up to 27 symbols across eight timeframes with seven analysis engines and an interactive cTrader dashboard.
Indicateur
ATR
SMC
+18
Super Wick detects powerful candle rejections: fractal long-wicks, HTF resonance zones, and a WSI gauge.
Indicateur
VWAP
Volume
+5
Multi VWAP. Three timeframes. One clean chart. Your Essential Trading Tool.
Indicateur
ATR
SMC
+5
Candles Volume Delta is a powerful, visually intuitive indicator that transforms raw tick volume into actionable trading
Indicateur
RSI
MACD
+7
The ZigZag indicator is a technical analysis tool primarily used to identify key price reversal points.
Indicateur
ATR
Key Levels
+1
Explore 88 harmonic price-pattern variants with interactive chart controls and geometric reference levels.
Indicateur
SMC
Forex
+5
Pure Price Action ICT Tools
Indicateur
ATR
Forex
+1
Trade fearlessly: auto-adjusts order blocks, manages risks, and ensures precision. Free for early users.

Prix

Depuis le 27/09/2026