说明
平均蜡烛时间振荡器 (ACTO)
通过ACTO提升您的交易表现,这是一款先进的振荡器,分析图表蜡烛的平均持续时间,使您能够快速识别波动性和市场活动的变化。
为什么选择ACTO?
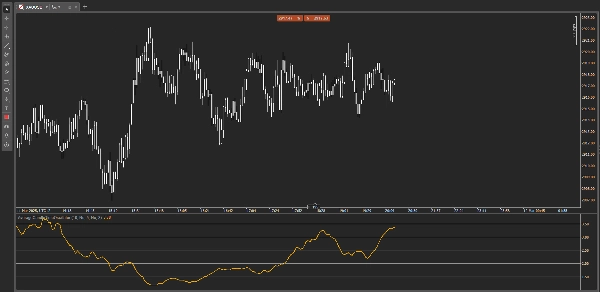
- 准确的蜡烛时间测量:轻松检测市场的缓慢或快速状态,优化您的进出场时机。
- 可定制阈值:设置特定阈值以突出关键时刻,及时应对市场节奏的变化。
- 自动提醒:当平均蜡烛持续时间超过您设定的阈值时,立即收到通知,确保您不会错过重要的交易机会。
- 用户友好界面:简单直观的显示,适合所有技能水平的交易者。
ACTO非常适合剥头皮交易、日内交易和短期时间框架交易,是任何希望基于市场时机动态预测重大市场波动的交易者的必备工具。
其他指标
摘要
指标配置
客户评价
4.5
评价:2
5 | 50 % | |
4 | 50 % | |
3 | 0 % | |
2 | 0 % | |
1 | 0 % |
客户评价
March 19, 2025
The product earns time when it gives the trader a reason to pause. Demo first makes more sense.
March 15, 2025
Bad impulses show up less often in the notes, but the market context still matters.
讨论
常见问答
Scalping
cTrader Store 提供的所有产品,包括交易机器人、指标和插件,均由第三方开发者提供,仅供信息参考和技术访问之用。cTrader Store 并非经纪商,不提供投资建议、个人推荐或任何未来业绩保证。
该作者的其他作品


价格
378.94M
交易量
1.9M
盈利点数