
Quantum Weighted Moving Average (QWMA)
インジケーター
バージョン 1.0、Mar 2025
Windows、Mac
4.0
レビュー: 2
説明
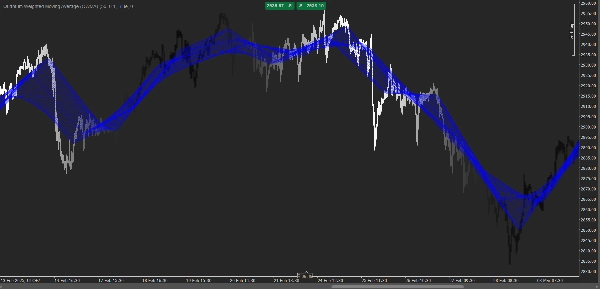
量子加重移動平均(QWMA)
この 量子加重移動平均(QWMA) は、市場の状況に応じて過去の価格の重み付けを動的に調整するために設計された高度な取引指標です。固定された重みを適用する従来の移動平均とは異なり、QWMAは適応的な指数減衰関数を使用して、過去のデータを考慮しつつも最近の価格変動により大きな重要性を割り当てます。
主な特徴:
✅ 適応的重み付け: ボラティリティとトレンドの強さに基づいて過去の価格の影響を調整します。
✅ 感度の向上: 単純移動平均や指数移動平均と比べて価格変動により迅速に反応します。
✅ ノイズ低減: トレンドの明瞭さを保ちながら市場のノイズをフィルタリングします。
✅ カスタマイズ可能なパラメータ: トレーダーが異なる取引戦略に合わせて減衰係数や重み付け関数を変更できます。
仕組み:
QWMAは過去の価格データに指数減衰関数を適用し、古い価格の影響力を減少させる一方で、最近の値がより大きく寄与するようにします。これにより、市場の動向の変化に適応する、より滑らかで反応性の高いトレンドラインが得られます。
適しているのは:
📈 トレンドフォロワー – 最小限の遅延で強いトレンドを識別します。
📉 スイングトレーダー – 標準的な移動平均よりも早く市場の反転を検出します。
💹 スキャルパー – 短期的なモメンタムの変化を迅速に把握します。
QWMAは、滑らかさと反応性のバランスを求めるトレーダーにとって強力なツールであり、株式、外国為替、暗号通貨取引など、さまざまな金融市場に適しています。🚀
概要
インジケーターのプロフィール
カスタマーレビュー
4.0
レビュー: 2
5 | 0 % | |
4 | 100 % | |
3 | 0 % | |
2 | 0 % | |
1 | 0 % |
ディスカッション
よくあるご質問
Forex
Crypto
Stocks
cTrader Storeで入手可能な取引ボット、インジケーター、プラグインなどの商品は、第三者の開発者が提供するものであり、情報と技術の取得のみを目的としてご利用いただけます。cTrader Storeはブローカーではなく、投資助言や個人的な推奨を行うことも、将来のパフォーマンスを保証することもありません。
この作成者の他の商品
これも好きかも


![「Smart Money Concepts (SMC) [Iridio Capital]」ロゴ](https://cdn.ctrader.com/image/webp/28b69fd1-ef54-4bed-9487-07e78e883be4_40934)


価格
378.94M
取引数量
1.9M
獲得pips