RSI - EMA Crossover Signals
指标
版本 1.0, Oct 2025
Windows 版、Mac 版
🎯 概述
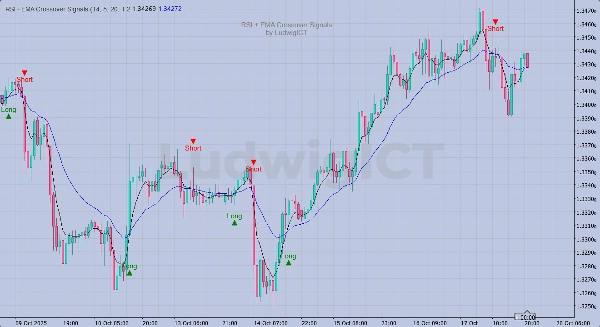
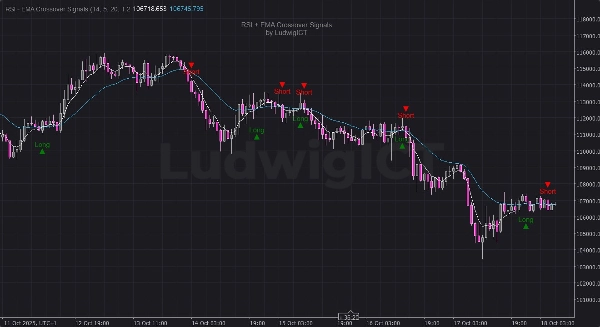
由 LudwigICT 开发的 RSI + EMA 交叉信号 指标结合了 动量 和 趋势 确认,直接在您的图表上生成高置信度的 多头/空头 交易信号。
⚙️ 工作原理:
- RSI 信号阶段:
-
- 当 RSI 穿越其自身的 SMA 信号线时,信号被激活。
- EMA 确认阶段:
-
- 仅当快 EMA 和慢 EMA 向同一方向交叉时,信号才被触发。
- 信号取消:
-
- 任何相反的交叉(RSI 或 EMA)都会取消未触发的信号。
✨ 主要特点:
- 🔁 双重确认逻辑(RSI + EMA)
- 📈 清晰的 多头 和 空头 图标直接绘制在图表上
- ⚡ 基于 ATR 的动态视觉偏移(自动调整波动性)
- 💧 干净的覆盖层,带有永久水印品牌
- 🧠 智能“激活”和“取消”逻辑以减少误触发
- 🧮 完全可调的 RSI、EMA 和偏移参数
🔧 输入参数:
- RSI 周期(默认:14)
- 快速 EMA(默认:5)
- 慢速 EMA(默认:20)
- 信号偏移(ATR 乘数,默认:1.2)
📊 适用对象:
- 动量交易者
- 趋势确认系统
- 手动或半自动交易策略
📅 版本更新:
- ✅ 添加基于 ATR 的动态偏移以增强视觉效果
- ✅ 改进信号准确性逻辑
- ✅ 添加不可移除的水印以保证真实性
© 2025 LudwigICT — 保留所有权利。
指标配置
0.0
评价:0
客户评价
该产品尚无评价。已经试过了?抢先告诉其他人!
BTCUSD
Forex
Signal
Breakout
Indices
EURUSD
Commodities
GBPUSD
NZDUSD
RSI
Scalping
Crypto
Stocks
XAUUSD
NAS100
ATR
MACD
USDJPY
cTrader Store 提供的所有产品,包括交易机器人、指标和插件,均由第三方开发者提供,仅供信息参考和技术访问之用。cTrader Store 并非经纪商,不提供投资建议、个人推荐或任何未来业绩保证。
该作者的其他作品


17.89M
交易量
60.07K
盈利点数
125
销售
4.67K
免费安装