TendSignal_indicator
インジケーター
159 ダウンロード数
バージョン 1.0、May 2025
Windows、Mac

説明
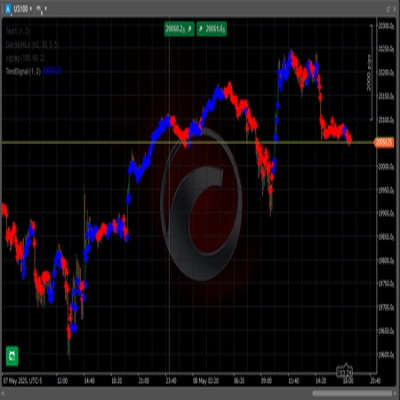
トレンドフォローシグナル
概要
AIによる概要
TendSignal_indicator is a trend-following signal indicator designed to assist traders by identifying market trends. It provides clear signals based on trend analysis to support decision-making in trading strategies. The product is categorized as a signal tool and is intended for use within trading platforms to enhance trend detection.
インジケーターのプロフィール
カスタマーレビュー
0.0
レビュー: 0
カスタマーレビュー
この商品にはまだレビューがありません。お使いになったことがある方は、ぜひレビューをお願いします。
ディスカッション
よくあるご質問
Signal
cTrader Storeで入手可能な取引ボット、インジケーター、プラグインなどの商品は、第三者の開発者が提供するものであり、情報と技術の取得のみを目的としてご利用いただけます。cTrader Storeはブローカーではなく、投資助言や個人的な推奨を行うことも、将来のパフォーマンスを保証することもありません。


価格
登録日 01/04/2025
240
無料インストール