
BWMFI_Visual
مؤشر
79 التنزيلات
الإصدار 1.0، May 2025
Windows, Mac
الوصف
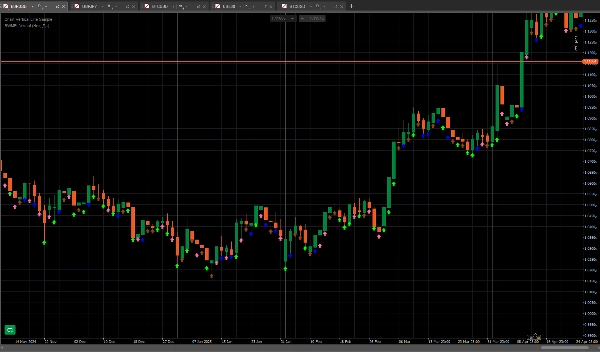
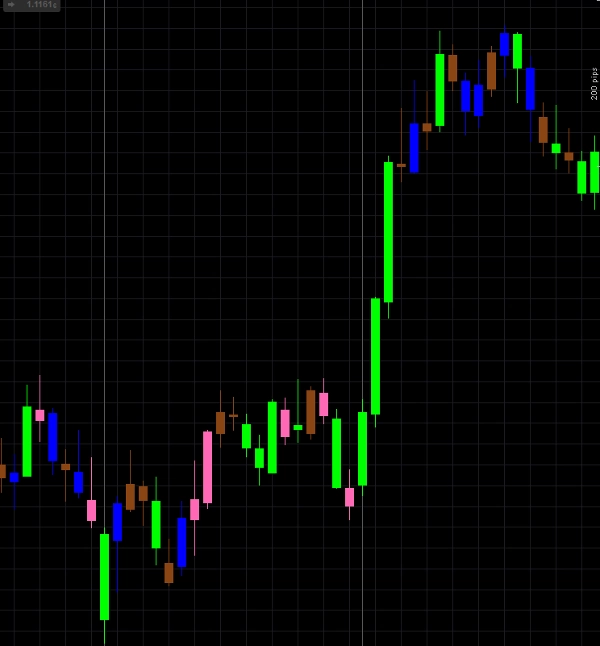
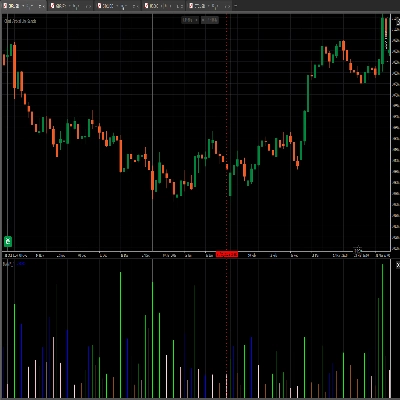
أشرطة ألوان BW_MFI Vizual
الملخص
ملخص الذكاء الاصطناعي
BWMFI_Visual is a trading indicator that visually represents the Money Flow Index (MFI) using color-coded bars. It provides a graphical display of the MFI values to assist traders in analyzing market momentum and potential price reversals. The indicator focuses on enhancing the visual interpretation of the MFI by applying distinct colors to the bars, facilitating quicker and clearer decision-making. This tool is designed for integration within trading platforms that support custom indicators.
ملف تعريف المؤشر
تقييمات العملاء
0.0
التقييمات: 0
تقييمات العملاء
لا توجد تقييمات لهذا المنتج حتى الآن. هل جرَّبته بالفعل؟ كن أول من يخبر الآخرين!
مناقشة
الأسئلة الشائعة
يتم توفير المنتجات المتاحة من خلال cTrader Store، بما في ذلك روبوتات التداول والمؤشرات والإضافات، من قبل مطوري الطرف الثالث وإتاحتها لأغراض الوصول المعلوماتي والفني فقط. cTrader Store ليس وسيطًا ولا يقدم نصائح استثمارية أو توصيات شخصية أو أي ضمان للأداء المستقبلي.
المزيد من هذا المؤلف


![شعار "[Hamster-Coder] Moving Average MTF"](https://cdn.ctrader.com/image/webp/b11b98b1-194d-4b8e-b00e-d611826ad159_31226)


السعر
منذ 10/03/2025
139
التثبيتات المجانية