
Scalper Signal MTF
مؤشر
256 التنزيلات
الإصدار 1.0، Aug 2025
Windows, Mac
الوصف
نظرة عامة
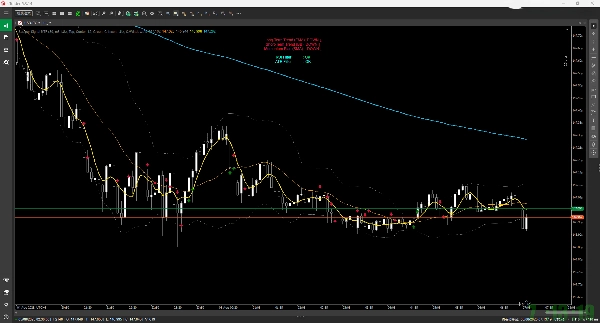
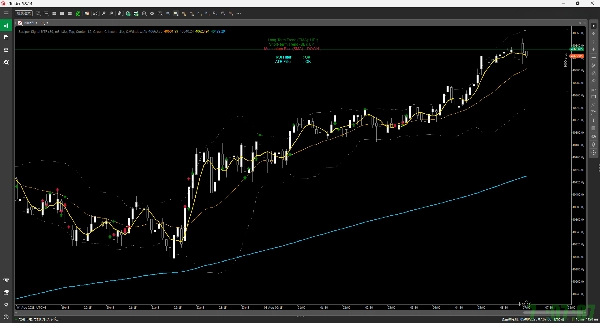
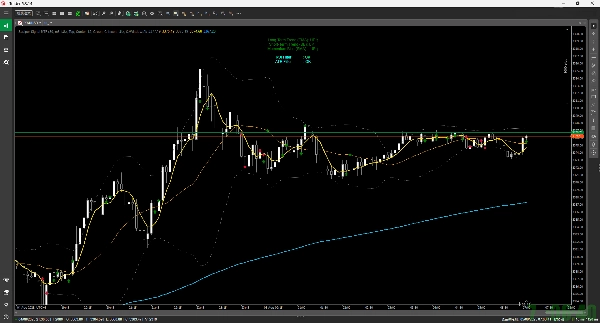
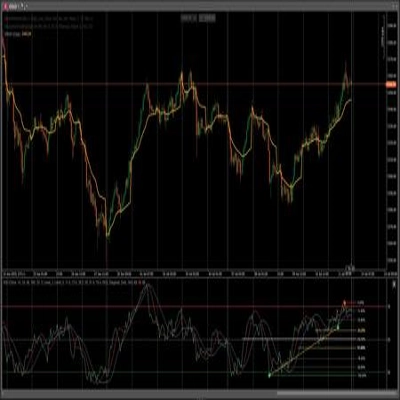
استنادًا إلى المؤشرات الفنية من إطار زمني محدد (مثل 5 دقائق)، يعرض إشارات الشراء/البيع (الأسهم) على الرسم البياني الحالي. كما يحاكي الصفقات بعد ظهور الإشارة ويرسم علامة (نجمة) عند نقطة الخروج المحتملة.
الميزات الرئيسية
- عرض إشارة الشراء/البيع:
-
- إشارة الشراء (السهم لأعلى): بناءً على تقاطع SMA الذهبي، مع شروط من RSI، و200 EMA، وBollinger Bands لتحديد فرص الشراء المناسبة.
- إشارة البيع (السهم لأسفل): بناءً على تقاطع SMA الميت، مع شروط من RSI، و200 EMA، وBollinger Bands لتحديد فرص البيع المناسبة.
- محاكاة التداول:
-
- بعد الإشارة، يفترض إغلاق الصفقة إذا تم استيفاء أي من الشروط التالية، ويضع علامة على الرسم البياني بأيقونة نجمة:
-
- جني الأرباح / وقف الخسارة (استنادًا إلى ATR ونسبة المخاطرة إلى العائد المحددة).
- لمس Bollinger Bands (الأشرطة العلوية/السفلية أو الخط الأوسط).
- تجاوز الحد الأقصى لمدة الاحتفاظ.
- يتم أيضًا حساب نقاط التعادل ووقفات التتبع داخليًا.
- عرض لوحة المعلومات:
-
- يعرض ملخصًا بسيطًا لبيئة السوق الحالية في أعلى يسار الرسم البياني، بما في ذلك الاتجاه طويل الأجل (EMA)، والاتجاه قصير الأجل (BB)، والزخم (SMA).
- وظيفة التنبيه:
-
- يوفر إشعارًا صوتيًا عند توليد إشارة جديدة.
المعلمات
يمكنك تخصيص العناصر التالية بحرية في إعدادات المؤشر:
- الإطار الزمني المستخدم للحسابات (MTF).
- الفترات للمؤشرات المختلفة (SMA، RSI، BB، EMA).
- قواعد خروج التداول (مثل نسبة المخاطرة إلى العائد، الحد الأقصى لمدة الاحتفاظ).
- إعدادات العرض للإشارات ولوحة المعلومات (الرؤية، الألوان، الحجم).
الملخص
ملخص الذكاء الاصطناعي
Scalper Signal MTF is a custom indicator designed for the cTrader platform that provides multi-timeframe scalping signals. It analyzes technical indicators from a chosen timeframe—such as 5 minutes—and displays buy (up arrow) and sell (down arrow) signals on the current chart. Buy signals are generated based on an SMA golden cross combined with RSI, 200 EMA, and Bollinger Bands conditions; sell signals use an SMA dead cross with similar criteria.
The indicator simulates trades after signals appear and marks potential exit points with a star icon. Trade exits are triggered by take profit or stop loss levels (calculated using ATR and a specified risk-reward ratio), touching Bollinger Bands, exceeding maximum holding time, or internal breakeven and trailing stop calculations.
A dashboard on the chart’s top-left summarizes the current market environment, showing long-term trend (EMA), short-term trend (Bollinger Bands), and momentum (SMA). The indicator also provides sound alerts when new signals occur.
Users can customize the timeframe for calculations, indicator periods (SMA, RSI, BB, EMA), trade exit rules, and display settings including signal and dashboard visibility, colors, and sizes.
ملف تعريف المؤشر
تقييمات العملاء
0.0
التقييمات: 0
تقييمات العملاء
لا توجد تقييمات لهذا المنتج حتى الآن. هل جرَّبته بالفعل؟ كن أول من يخبر الآخرين!
مناقشة
الأسئلة الشائعة
يتم توفير المنتجات المتاحة من خلال cTrader Store، بما في ذلك روبوتات التداول والمؤشرات والإضافات، من قبل مطوري الطرف الثالث وإتاحتها لأغراض الوصول المعلوماتي والفني فقط. cTrader Store ليس وسيطًا ولا يقدم نصائح استثمارية أو توصيات شخصية أو أي ضمان للأداء المستقبلي.
المزيد من هذا المؤلف


السعر
1
المبيعات
1.37K
التثبيتات المجانية