
ScalperSignalVisual
مؤشر
191 التنزيلات
الإصدار 1.0، Aug 2025
Windows, Mac
الوصف
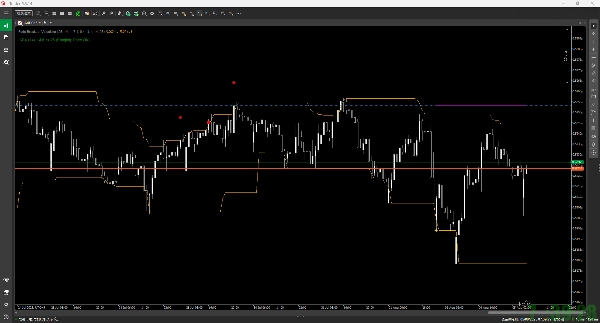
هذا المؤشر هو أداة لتصور منطق التداول لاستراتيجية معاكسة تسمى "تراجع الاختراق" على الرسم البياني الخاص بك. لا يقوم بتنفيذ صفقات فعلية ولكنه يظهر كيف سيتم إدارة المركز من الدخول إلى الخروج عند حدوث إشارة.
الميزات الرئيسية
- إشارات الدخول:
-
- يستخدم قناة دونشيان.
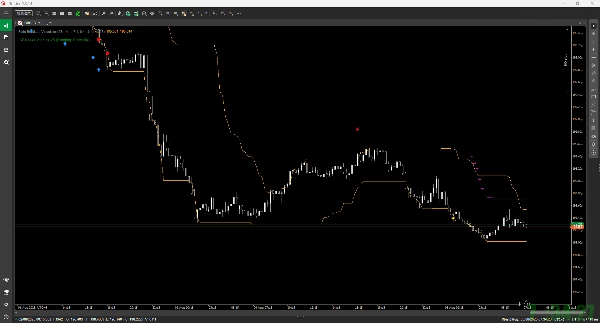
- إشارة شراء (معاكسة): عندما ينخفض السعر تحت الحد السفلي لقناة دونشيان، يعرض إشارة شراء (سهم أزرق لأعلى ↑).
- إشارة بيع (معاكسة): عندما يخترق السعر الحد العلوي لقناة دونشيان، يعرض إشارة بيع (سهم أحمر لأسفل ↓).
- إدارة المخاطر:
-
- عند الدخول، يتم رسم وقف خسارة أولي (خط أحمر منقط) وأول جني أرباح (خط أخضر منقط)، بناءً على ATR (المتوسط الحقيقي للنطاق).
- عند الوصول إلى أول جني أرباح (TP1)، يظهر نجم ذهبي (★)، ويتم نقل وقف الخسارة إلى سعر الدخول (نقطة التعادل).
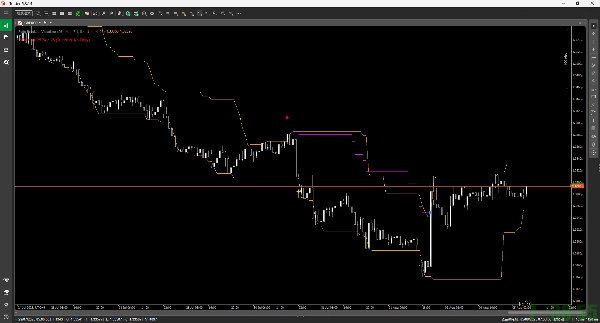
- بعد ذلك، يتم تفعيل وقف متحرك يعتمد على ATR لتأمين الأرباح من خلال متابعة السعر. يتم عرض مسار الوقف المتحرك كخط أرجواني.
- خروج الصفقات:
-
- وقف الخسارة: إذا وصل السعر إلى مستوى وقف الخسارة، يتم تمييزه بمربع أحمر (■).
- خروج الوقف المتحرك: إذا وصل السعر إلى الوقف المتحرك، يتم تمييزه بمربع أزرق (■).
- مرشح ADX:
-
- يمكنك تمكين مرشح ADX اختياريًا.
- إذا كان ADX أعلى من قيمة محددة (مما يشير إلى اتجاه قوي)، فسيتم تعطيل إشارات الدخول الجديدة. يتم عرض الحالة الحالية (الدخول مسموح / لا دخول) في النص أعلى يسار الرسم البياني.
الملخص
ملف تعريف المؤشر
تقييمات العملاء
0.0
التقييمات: 0
تقييمات العملاء
لا توجد تقييمات لهذا المنتج حتى الآن. هل جرَّبته بالفعل؟ كن أول من يخبر الآخرين!
مناقشة
الأسئلة الشائعة
يتم توفير المنتجات المتاحة من خلال cTrader Store، بما في ذلك روبوتات التداول والمؤشرات والإضافات، من قبل مطوري الطرف الثالث وإتاحتها لأغراض الوصول المعلوماتي والفني فقط. cTrader Store ليس وسيطًا ولا يقدم نصائح استثمارية أو توصيات شخصية أو أي ضمان للأداء المستقبلي.
المزيد من هذا المؤلف


السعر
1
المبيعات
1.34K
التثبيتات المجانية