
الوصف
📊 **خريطة السوق اللوغاريتمية المتقدمة من PrimeQuant**
امنح مخططاتك هيكلًا ووضوحًا من خلال إطار عمل احترافي قائم على اللوغاريتمات مصمم للتداول الدقيق.
🔹 **الميزات الرئيسية**
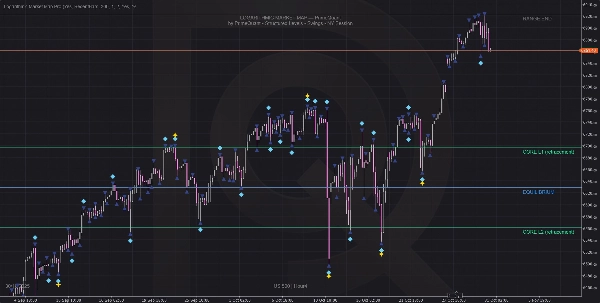
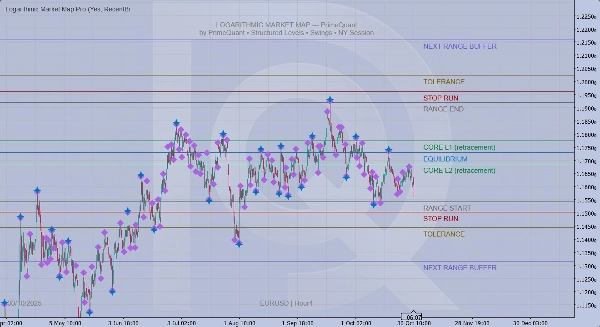
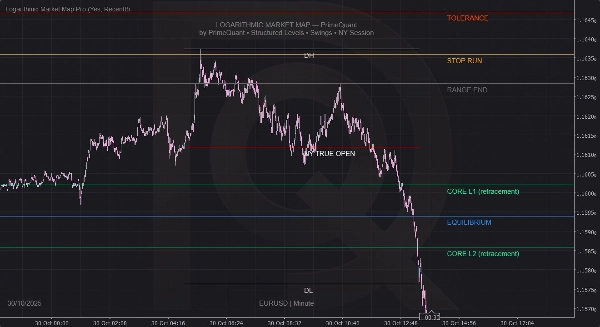
• 🧭 شبكة إطار عمل لوغاريتمية تلقائية — بداية/نهاية النطاق، CORE L1/L2، التوازن، مناطق التسامح والتوقف
• 📈 اكتشاف تأرجح متعدد المستويات — نقاط التحول قصيرة الأجل (ST)، متوسطة الأجل (IT)، وطويلة الأجل (LT) لإيقاع سوق واضح
• 🕒 تخطيط جلسة نيويورك — الافتتاح الحقيقي، أعلى/أدنى يومي (DH/DL) وعلامات الجلسة العمودية
• ⚙️ ألوان وقوائم مرئية قابلة للتخصيص بالكامل لأي نمط من المخططات
• 🎯 يحدد على الفور المناطق المتوازنة وغير المتوازنة للدخول الدقيق وإدارة النطاق
• 🪶 تراكب نظيف وغير متطفل مع تباعد تأرجح قابل للتعديل تلقائيًا لتجنب الفوضى
💡 **كيفية الاستخدام**
قم بإرفاق المؤشر بأي رمز أو إطار زمني ودع الإطار يكشف التوازن الهيكلي، والتراجعات الرئيسية، وحدود الجلسة — مثالي للتداول بالتأرجح، النطاق، أو أسلوب SMC.
العلامة التجارية من **PrimeQuant — أدوات دقيقة للمتداولين المحترفين**
الملخص
تقييمات العملاء
5 | 50 % | |
4 | 50 % | |
3 | 0 % | |
2 | 0 % | |
1 | 0 % |