
Dynamic Trend Flux
مؤشر
الإصدار 1.0، Nov 2025
Windows, Mac
4.0
التقييمات: 1
الوصف
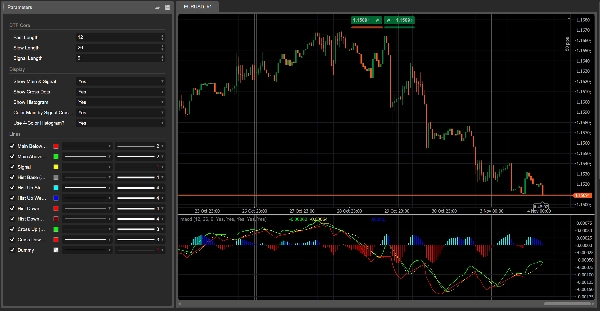
تدفق الاتجاه الديناميكي
النوع: مذبذب الزخم / الاتجاه (على غرار MACD، متعدد الألوان)
ما يفعله
تدفق الاتجاه الديناميكي هو مذبذب زخم ملون يعتمد على الفرق الكلاسيكي بين EMA السريع والبطيء بالإضافة إلى خط إشارة.
يساعدك على رؤية ما يلي بسرعة:
- متى الزخم صعودي أو هبوطي،
- ما إذا كان الزخم يتقوى أو يضعف،
- وأين تحدث تحولات الاتجاه (تقاطع الخط الرئيسي مع خط الإشارة).
المؤشر يرسم:
- الخط الرئيسي (خط التدفق)
-
- مبني على الفرق بين EMA السريع والبطيء
- يتغير لونه اعتمادًا على ما إذا كان أعلى أو أسفل خط الإشارة (اختياري).
- خط الإشارة
-
- متوسط متحرك للخط الرئيسي، يستخدم كـ مُشغل أكثر سلاسة.
- مخطط بياني بأربعة ألوان (اختياري)
-
- يعرض المسافة بين الخط الرئيسي وخط الإشارة،
- اللون يرمز لكل من الاتجاه (أعلى/أسفل الصفر) و تغير القوة من شريط لآخر.
- نقاط على التقاطعات (اختياري)
-
- تُبرز مكان تقاطع الخط الرئيسي مع خط الإشارة → احتمالية تغيرات مرحلة الاتجاه.
جميع الحسابات تتم على الإطار الزمني الحالي للرسم البياني.
كيفية قراءته
1. خط الصفر
- القيم أعلى من الصفر → يهيمن الضغط الصعودي.
- القيم أدنى من الصفر → يهيمن الضغط الهبوطي.
2. المخطط البياني الملون
مع تشغيل وضع الألوان الأربعة:
- أكوا → أعلى من الصفر ومتزايد
-
- زخم صعودي قوي / متزايد.
- أزرق → أعلى من الصفر لكنه يتراجع
-
- الاتجاه الصعودي لا يزال قائمًا، لكن الزخم يضعف.
- أحمر → أدنى من الصفر ويتراجع
-
- زخم هبوطي قوي / متزايد.
- مارون → أدنى من الصفر لكنه يرتفع
-
- المرحلة الهبوطية لا تزال قائمة، لكن الزخم يفقد قوته.
هذا يجعل من السهل بصريًا اكتشاف التباينات وتحولات الزخم.
3. الخطوط الرئيسية وخط الإشارة
- الخط الرئيسي أعلى من الإشارة → مرحلة صعودية.
- الخط الرئيسي أسفل من الإشارة → مرحلة هبوطية.
إذا تم تفعيل تغيير اللون:
- الخط الرئيسي ليموني = أعلى من الإشارة (سيطرة صعودية)
- الخط الرئيسي أحمر = أسفل من الإشارة (سيطرة هبوطية)
4. نقاط التقاطع
- نقطة خضراء (تقاطع صاعد) → الخط الرئيسي يتقاطع أعلى من الإشارة
-
- بداية محتملة لـ تأرجح صعودي.
- نقطة حمراء (تقاطع هابط) → الخط الرئيسي يتقاطع أسفل من الإشارة
-
- بداية محتملة لـ تأرجح هبوطي.
دائمًا اجمع هذه الإشارات مع الهيكل / حركة السعر وسياق الإطار الزمني الأعلى.
المعلمات (بالإنجليزية)
جوهر DTF
- الطول السريع – فترة EMA السريع (الافتراضي 12).
- الطول البطيء – فترة EMA البطيء (الافتراضي 26).
- طول الإشارة – فترة SMA للإشارة المطبقة على الخط الرئيسي (الافتراضي 9).
العرض
- عرض الخط الرئيسي وخط الإشارة – يبدل الخطين.
- عرض نقاط التقاطع – يعرض نقاط على تقاطعات الخط الرئيسي/الإشارة.
- عرض المخطط البياني – يبدل المخطط البياني في الخلفية.
- تلوين الخط الرئيسي حسب تقاطع الإشارة؟
-
- تشغيل → الخط الرئيسي ليموني فوق الإشارة، أحمر تحتها.
- إيقاف → الخط الرئيسي يبقى أحمر.
- استخدام مخطط بياني بأربعة ألوان؟
-
- تشغيل → منطق أكوا / أزرق / أحمر / مارون.
- إيقاف → المخطط البياني بلون رمادي واحد.
الملخص
ملف تعريف المؤشر
تقييمات العملاء
4.0
التقييمات: 1
5 | 0 % | |
4 | 100 % | |
3 | 0 % | |
2 | 0 % | |
1 | 0 % |
مناقشة
الأسئلة الشائعة
Signal
Indices
Commodities
GBPUSD
RSI
Bollinger
Fibonacci
Scalping
AI
XAUUSD
NAS100
MACD
BTCUSD
Forex
Breakout
EURUSD
NZDUSD
Martingale
Prop
ZigZag
Supertrend
Fair Value Gap
SMC
Crypto
Grid
Stocks
ATR
USDJPY
VWAP
يتم توفير المنتجات المتاحة من خلال cTrader Store، بما في ذلك روبوتات التداول والمؤشرات والإضافات، من قبل مطوري الطرف الثالث وإتاحتها لأغراض الوصول المعلوماتي والفني فقط. cTrader Store ليس وسيطًا ولا يقدم نصائح استثمارية أو توصيات شخصية أو أي ضمان للأداء المستقبلي.


السعر
42.11M
حجم التداول
6.13M
الربح بالبيب
221
المبيعات
8.36K
التثبيتات المجانية