Description
Bounty Killa – l'indicateur qui détecte les chasses aux stops avant les gros acteurs.
Bounty Killa est un indicateur cTrader conçu pour les traders qui aiment trader les chasses aux stops / saisies de liquidité : ces chandeliers qui dépassent les plus hauts ou les plus bas récents, déclenchent les stops puis repartent dans la direction opposée.
L'indicateur analyse automatiquement chaque chandelier et signale :
- SHS (Stop Hunt High) – probable chasse aux stops au-dessus des plus hauts récents → zone à surveiller pour des configurations short
- SHL (Stop Hunt Low) – probable chasse aux stops en dessous des plus bas récents → zone à surveiller pour des configurations long
La logique de détection repose sur :
- la rupture des plus hauts/bas récents d'au moins X pips,
- une longue mèche dépassant ce niveau,
- un petit corps et une clôture dans la direction opposée à la cassure.
Fini les suppositions du type « peut-être que c'était une chasse aux stops » : Bounty Killa met en évidence les chandeliers clés directement sur votre graphique, avec des étiquettes claires, des couleurs et une légende intégrée.
Pourquoi les traders l'apprécient :
- Montre où le marché a pu saisir de la liquidité et où un retournement devient plus significatif.
- Entièrement personnalisable : fenêtre de recherche, cassure minimale en pips, pourcentages corps/mèche, décalage du signal.
- Se combine parfaitement avec les concepts classiques de support/résistance, offre & demande, volume, blocs d'ordres et concepts SMC.
- Idéal pour les traders qui suivent des configurations basées sur la liquidité mais veulent quelque chose de objectif et basé sur des règles plutôt que du simple ressenti.
⚠️ Bounty Killa n'est pas un système de trading complet et n'ouvre ni ne ferme de trades.
Les chandeliers marqués sont des zones à haute information qui doivent être intégrées à votre propre stratégie, analyse de tendance et gestion des risques.
Bounty Killa – Guide rapide de l'utilisateur (EN)
1. Marchés et unités de temps recommandés
- Unités de temps : H1, H4, D1
(Unités plus basses comme M1–M5 = beaucoup de bruit, à utiliser principalement pour étude.) - Symboles : indices, FX, crypto, actions, matières premières – partout où vous pouvez attacher un indicateur cTrader.
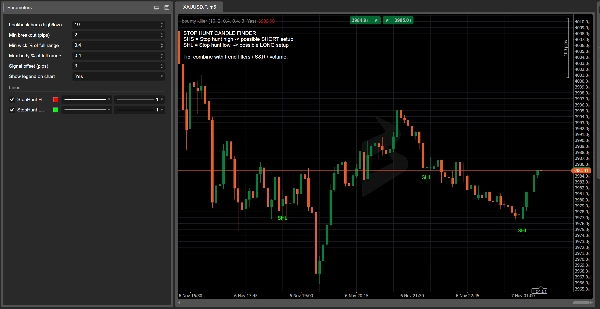
2. Comment lire les signaux
- SHS – Stop Hunt High (étiquette rouge au-dessus du chandelier)
-
- Le prix dépasse les plus hauts récents, crée une longue mèche supérieure, et clôture à la baisse.
- Idée : configuration short potentielle après une fausse cassure et une saisie de liquidité au-dessus des plus hauts.
- SHL – Stop Hunt Low (étiquette verte en dessous du chandelier)
-
- Le prix descend en dessous des plus bas récents, crée une longue mèche inférieure, et clôture à la hausse.
- Idée : configuration long potentielle après une fausse cassure à la baisse et une saisie de liquidité en dessous des plus bas.
Bounty Killa ne dit pas « achetez/vendez maintenant ».
Il met en évidence des zones de liquidité où un retournement a plus de sens.
3. Paramètres de base suggérés
Dans les paramètres de l'indicateur :
- Barres de recherche (haut/bas) :
10–20
→ combien de barres regarder en arrière pour les plus hauts/bas récents. - Cassure min (pips) :
5–15pips
→ distance minimale au-delà du haut/bas pour compter comme une chasse aux stops. - % mèche min de la plage totale :
0.60–0.70
→ au moins 60–70% du chandelier doit être mèche dans la direction de la chasse aux stops. - % corps max de la plage totale :
0.25–0.35
→ petit corps comparé à la plage totale du chandelier. - Décalage du signal (pips) :
3–5
→ uniquement visuel, déplace légèrement l'étiquette SHS/SHL par rapport au chandelier.
4. Exemple simple de stratégie
Filtre de tendance (EMA 200) :
- Ajoutez une EMA 200 à votre graphique.
- Shorts uniquement :
-
- Prix en dessous de l'EMA 200
- Vous obtenez un signal SHS (stop hunt high).
- Longs uniquement :
-
- Prix au-dessus de l'EMA 200
- Vous obtenez un signal SHL (stop hunt low).
Idée d'entrée :
- Attendez que le chandelier de chasse aux stops se ferme.
- Entrez sur le chandelier suivant seulement si le prix confirme :
-
- Pour SHS : le chandelier suivant casse le bas du chandelier SHS → envisagez un short.
- Pour SHL : le chandelier suivant casse le haut du chandelier SHL → envisagez un long.
Stop loss :
- Pour SHS (short) → SL juste au-dessus du plus haut du chandelier SHS.
- Pour SHL (long) → SL juste en dessous du plus bas du chandelier SHL.
Take profit :
- Visez au moins 1:1.5 ou 1:2 R/R, ou
- Utilisez les plus hauts/bas de swing proches, support/résistance ou zones d'offre/demande comme objectifs.
5. Notes de sécurité & checklist rapide
Avant d'utiliser un signal Bounty Killa, demandez-vous :
- Tendance ?
Le signal est-il aligné avec la tendance générale (EMA 200 / structure du marché) ? - Niveau ?
La chasse aux stops se produit-elle à un niveau significatif (plus haut/bas précédent, S/R, plus haut/bas de session, etc.) ? - Contexte ?
Des actualités, ouverture/fermeture de session, pics de volatilité ? - Risque ?
La taille de votre stop est-elle adaptée à votre gestion monétaire (max % par trade) ?
Si 3–4 de ces points sont réunis, le SHS/SHL de Bounty Killa n'est pas juste « un joli chandelier », mais une zone à haute valeur autour de laquelle construire une idée de trade.
Résumé
The detection criteria include a breakout beyond recent highs/lows by a configurable number of pips, a long wick extending beyond that level, a small candle body, and a close opposite to the breakout direction. Signals are displayed directly on the chart with clear labels and colors, supported by an on-chart legend.
Recommended for use on hourly to daily timeframes (H1, H4, D1) across various markets including forex, indices, cryptocurrencies, stocks, and commodities, Bounty Killa is fully customizable with parameters such as lookback period, minimum breakout size, wick and body proportions, and signal label offset.
The indicator highlights high-value liquidity zones to support trading decisions but does not execute trades. It is intended to be combined with other analysis tools like support/resistance, volume, order blocks, and trend filters (e.g., 200 EMA) for developing objective, rule-based liquidity-based trading setups.
Avis clients
5 | 50 % | |
4 | 50 % | |
3 | 0 % | |
2 | 0 % | |
1 | 0 % |


