الوصف
📌 ما الذي يفعله المؤشر
MarketStructureOscSignals هو أداة إشارة تعتمد فقط على حركة السعر.
هو:
- يكشف القمم والقيعان المتأرجحة باستخدام نظرة إلى الوراء لليسار/اليمين.
- يتتبع ما إذا كانت تلك التقلبات تشكل:
-
- قمم أعلى + قيعان أعلى → هيكل صاعد
- قمم أدنى + قيعان أدنى → هيكل هابط
- عندما يتغير الهيكل:
-
- من هابط → صاعد → يرسم إشارة شراء
- من صاعد → هابط → يرسم إشارة بيع
لذا كل إشارة تمثل تغيرًا حقيقيًا في هيكل السوق، وليس مجرد تقاطع لمتوسط متحرك.
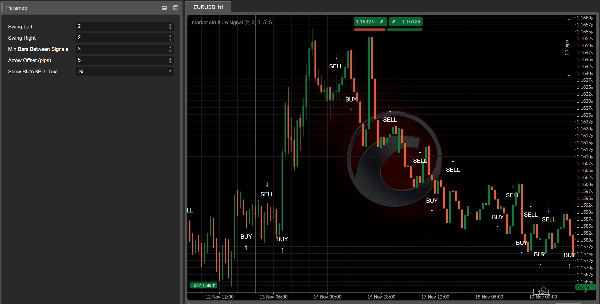
⚙️ المدخلات وكيفية ضبطها
1. Swing Left / Swing Right
هذه تتحكم في مدى “صرامة” القمة/القاع المتأرجح.
- Swing Left (الافتراضي 2)
عدد الأعمدة إلى اليسار من التقلب التي يجب أن تكون فيها القمم أقل (للقمة المتأرجحة) أو القيعان أعلى (للقاع المتأرجح). - Swing Right (الافتراضي 2)
عدد الأعمدة إلى اليمين التي يجب أن تؤكد أيضًا التقلب.
كيفية الاستخدام:
- القيم الصغيرة (1–2):
-
- المزيد من التقلبات، المزيد من الإشارات
- يعمل جيدًا على الأطر الزمنية الأعلى (H1, H4, D1)
- القيم الأكبر (3–4+):
-
- فقط التحولات الهيكلية الكبرى
- إشارات أقل لكنها أقوى
- جيد على الأطر الزمنية الأقل لتجنب الضوضاء
2. Min Bars Between Signals
الحد الأدنى لعدد الأعمدة التي يجب أن تمر بين إشارتين.
- يتجنب تكدس الأسهم عند كل تراجع صغير.
- مثال:
-
- ضبط على
3→ على الأقل 3 أعمدة بين إشارة وأخرى. - على الرسوم البيانية السريعة جدًا (M1–M5) قد ترغب في
5–10. - على H1 أو أعلى،
2–3عادةً ما تكون كافية.
- ضبط على
3. Arrow Offset (pips)
المسافة التي يتم وضع السهم والتسمية منها بعيدًا عن الشمعة (بالبِب).
- للعملات الأجنبية (الفوركس):
-
5–10بِب عادة ما تبدو جيدة.
- للمؤشرات (US500, US100، إلخ):
-
- استخدم تعويضًا أكبر (مثلاً 20–50 "بِب" حسب حجم بِب الوسيط).
إذا تداخلت الأسهم مع الشموع، زد هذه القيمة.
إذا كانت بعيدة جدًا، قللها.
4. Show BUY/SELL Text
true→ يعرض كل من السهم (↑/↓) والنص "BUY" أو "SELL".false→ الأسهم فقط.
إذا كان الرسم البياني يبدو مزدحمًا، يمكنك إخفاء النص والاحتفاظ بالأسهم فقط.
🔍 كيف يتم توليد الإشارات (المنطق)
داخليًا، المؤشر:
- يتتبع أحدث قمم متأرجحة اثنتين و أحدث قيعان متأرجحة اثنتين:
-
_prevHigh،_lastHigh_prevLow،_lastLow
- من هذه يتحقق من:
-
- هل القمم والقيعان كلاهما يرتفع؟
-
- → اتجاه صاعد (
StructureTrendSignal.Bullish)
- → اتجاه صاعد (
- هل القمم والقيعان كلاهما ينخفض؟
-
- → اتجاه هابط (
StructureTrendSignal.Bearish)
- → اتجاه هابط (
- إذا لم تكن متوافقة، يحتفظ بالاتجاه السابق.
- في كل مرة يتغير فيها الاتجاه الهيكلي:
-
هابط → صاعد→ إشارة شراءصاعد → هابط→ إشارة بيع
- كما يضمن:
-
- أن الاتجاه لم يكن
Unknown(أي ليس في البداية تمامًا). - مرور عدد كافٍ من الأعمدة منذ الإشارة الأخيرة (
MinBarsBetweenSignals).
- أن الاتجاه لم يكن
هذا يعني أن كل سهم يشير إلى تحول هيكلي حقيقي، وليس ضوضاء عشوائية.
📈 كيفية قراءة إشارات الشراء/البيع على الرسم البياني
✅ إشارة شراء
ما تراه:
- سهم صاعد
↑تحت الشمعة - اختياريًا النص “BUY” بالقرب من السهم
ما يعنيه:
- تغير الهيكل من هابط → صاعد.
- القمم والقيعان المتأرجحة الأخيرة كلاهما يتحرك للأعلى.
- من المحتمل أن ينتقل السوق إلى اتجاه صاعد جديد أو يستأنف الهيكل الصاعد.
كيفية استخدامه:
- ابحث عن مداخل شراء طويلة:
-
- على شمعة الإشارة أو على الشموع القليلة التالية.
- ويفضل بعد تراجع صغير إلى مستوى دعم (القاع المتأرجح السابق، منطقة الطلب، VWAP، VA low، إلخ).
- استخدم أدوات مثل Kalman Trend / EMA / Volume Profile للتصفية:
-
- خذ إشارات الشراء فقط عندما يكون الإطار الزمني الأعلى أو Kalman صاعدًا أيضًا.
✅ إشارة بيع
ما تراه:
- سهم هابط
↓فوق الشمعة - اختياريًا النص “SELL”
ما يعنيه:
- تغير الهيكل من صاعد → هابط.
- القمم والقيعان المتأرجحة الآن كلاهما يتحركان للأسفل.
- من المحتمل أن يدخل السوق في اتجاه هابط أو يستأنف الهيكل الهابط.
كيفية استخدامه:
- ابحث عن مداخل بيع قصيرة:
-
- على شمعة الإشارة أو على الشموع التالية بالقرب من المقاومة.
- مثالي بعد إعادة اختبار دعم مكسور (أصبح الآن مقاومة)، VAH، منطقة العرض، إلخ.
🎯 الاستخدامات العملية للتداول
1. كأداة دخول مستقلة
مجموعة قواعد بسيطة:
- إعداد الشراء
-
- انتظر ظهور سهم شراء.
- ضع أمر شراء طويل عند/قرب شمعة الإشارة.
- وقف الخسارة أسفل القاع المتأرجح الأخير.
- الهدف هو القمة المتأرجحة السابقة أو مقاومة رئيسية.
- إعداد البيع
-
- انتظر ظهور سهم بيع.
- ضع أمر بيع قصير عند/قرب شمعة الإشارة.
- وقف الخسارة فوق القمة المتأرجحة الأخيرة.
- الهدف هو القاع المتأرجح السابق أو دعم رئيسي.
هذا هو الاستخدام الأساسي ويعمل بشكل أفضل على H1, H4, و D1، حيث يكون الهيكل أكثر وضوحًا.
2. كأداة تأكيد مع مؤشراتك الأخرى
هنا يصبح قويًا.
🔹 مع مرشح كالمان للاتجاه
- خذ فقط إشارات الشراء عندما:
-
- اتجاه كالمان يميل للأعلى والسعر عند أو فوق خط كالمان.
- خذ فقط إشارات البيع عندما:
-
- اتجاه كالمان يميل للأسفل والسعر عند أو تحت خط كالمان.
التأثير:
يعطيك كالمان اتجاهًا سلسًا، ويعطيك MarketStructureOscSignals تحولات هيكلية دقيقة. معًا يقومان بتصفية الكثير من الصفقات السيئة.
🔹 مع ملف الحجم / الدعم والمقاومة
- شراء قوي:
-
- يظهر سهم الشراء قريبًا من VA Low، القاع المتأرجح السابق، أو مسح السيولة، مع رفض.
- بيع قوي:
-
- يظهر سهم البيع قريبًا من VA High، القمة المتأرجحة السابقة، أو مسح السيولة في الأعلى.
هنا الإشارة ليست مجرد نمط تقني ولكنها أيضًا مرتبطة بـ مناطق السيولة وتدفق الأوامر.
3. للتدرج في الدخول/الخروج
يمكنك أيضًا استخدام الإشارات الجديدة كـ:
- نقاط التدرج في الدخول
أضف إلى مركز عندما تظهر إشارة جديدة في نفس اتجاه تداولك الحالي و الإطار الزمني الأعلى متوافق. - الخروج المبكر / الخروج الجزئي
إذا كنت في مركز شراء وظهرت إشارة بيع ضد مركزك (خاصة بالقرب من هيكل رئيسي)، يمكنك: -
- إغلاق جزء من المركز
- أو تشديد وقف الخسارة
🧪 الإعدادات الموصى بها للبدء
لـ الفوركس H1 / H4:
Swing Left = 2Swing Right = 2Min Bars Between Signals = 3Arrow Offset = 5–10 pips
لـ المؤشرات M15 / H1:
Swing Left = 2–3Swing Right = 2–3Min Bars Between Signals = 5Arrow Offsetتم تعديله حسب الرمز (مثلاً 20–50 "بِب" حسب الوسيط)
لـ العملات الرقمية H1 / H4:
- تقلبات أعلى قليلاً لتصفية الضوضاء:
-
Swing Left = 3Swing Right = 3Min Bars Between Signals = 4–6
قم دائمًا باختبار رجعي باستخدام أداتك والإطار الزمني المفضل لضبط Swing و MinBarsBetweenSignals.
الملخص
تقييمات العملاء
5 | 100 % | |
4 | 0 % | |
3 | 0 % | |
2 | 0 % | |
1 | 0 % |


