الوصف
⭐ منطقة SMC متعددة الأطر الزمنية™ 🇫🇮
رسم خرائط العرض والطلب المؤسسي عبر خمسة أطر زمنية — تلقائيًا.
منتج احترافي
محرك منطقة SMC متعددة الأطر الزمنية™ هو مؤشر ذكي مبني بدقة يكتشف تلقائيًا ويرسم ويزامن مناطق العرض والطلب المؤسسية عبر خمسة أطر زمنية رئيسية — كل ذلك في الوقت الحقيقي، مباشرة على الرسم البياني الخاص بك.
مصمم للمتداولين الذين يعتمدون على هيكل السوق، وسلوك السيولة، وبصمات المؤسسات، هذه الأداة تلغي التخمين وعدم الاتساق في تحديد المناطق يدويًا. سواء كنت تتداول داخل اليوم أو على المدى المتوسط، يمنحك محرك منطقة SMC متعددة الأطر الزمنية™ خريطة كاملة ومتعددة الطبقات لأماكن تفاعل السوق المحتملة.
هذا ليس مجرد مؤشر.
إنه نظام ذكاء SMC متعدد الأطر الزمنية.
القدرات الأساسية
الكشف التلقائي عن مناطق العرض والطلب
يقوم المحرك بمسح آخر X أشرطة (يحددها المستخدم) على كل إطار زمني ويحدد:
مناطق الطلب (اختلالات صاعدة)
مناطق العرض (اختلالات هابطة)
يتم التحقق من صحة المناطق باستخدام هيكل الشمعة — مما يضمن عرض بصمات مؤسسية ذات معنى فقط.
خمسة أطر زمنية، رسم بياني واحد
يقوم المؤشر بتحليل في نفس الوقت
يومي
4 ساعات
ساعة واحدة
30 دقيقة
15 دقيقة
يتم تعيين لون فريد لكل إطار زمني، مما يمنحك عرضًا نظيفًا ومتعدد الطبقات لقوة الإطار الزمني الأعلى ودقة الإطار الزمني الأدنى.
هذا الدمج متعدد الأطر الزمنية هو ما يعتمد عليه متداولو SMC لتوقع مسح السيولة، كتل التخفيف، ومناطق السعر المميز/المخفض.
إسقاط المنطقة الديناميكي
يتم تمديد كل منطقة تلقائيًا إلى أحدث شمعة، مما يتيح لك رؤية:
مكان احتمال تفاعل السعر
أي المناطق لا تزال نشطة
كيف يتفاعل السعر الحالي مع البصمات المؤسسية
لا إعادة رسم يدوي. لا ازدحام. لا مناطق قديمة.
مرئيات احترافية
تتضمن كل منطقة:
مستطيل ملون مع عرض حدود قابل للتعديل
تسمية نصية واضحة (“طلب: H1”، “عرض: M15”، إلخ)
وضع ذكي مع إزاحة إلى اليسار لتجنب تداخل الشموع
النتيجة هي خريطة SMC نظيفة، قابلة للقراءة، وذات جودة احترافية.
لماذا يحبها المتداولون
تلغي تحديد المناطق يدويًا
توفر سياقًا فوريًا متعدد الأطر الزمنية
تساعد في تحديد نقاط تفاعل عالية الاحتمالية
تعمل مع أي استراتيجية تعتمد على مفاهيم SMC، ICT، ويكوف، أو مفاهيم السيولة
مرئيات نظيفة لا تزدحم على الرسم البياني الخاص بك
مثالية لكل من المتداولين داخل اليوم والمتداولين على المدى المتوسط
تمنحك هذه الأداة منظور المؤسسات — بدون التعقيد.
لمن هذا المؤشر
متداولو مفاهيم المال الذكي
متداولو السيولة بأسلوب ICT
متداولو هيكل السوق وتدفق الأوامر
المتداولون السريعون الذين يحتاجون إلى دقة
متداولو المدى المتوسط الذين يحتاجون إلى سياق إطار زمني أعلى
أي شخص يريد خريطة عرض/طلب نظيفة ومؤتمتة
⭐ MULTI‑TIMEFRAME SMC ZONE™
تداول بوضوح بصمات المؤسسات — عبر كل إطار زمني مهم
ملاحظات
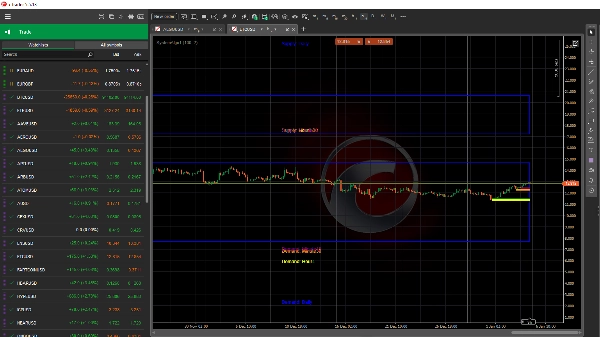
الأزرق = طلب/عرض يومي
الأخضر = طلب/عرض 4 ساعات
الأصفر = طلب/عرض ساعة واحدة
البنفسجي الداكن = طلب/عرض 15 دقيقة
الوردي = طلب/عرض 5 دقائق
عند التداخل > احتمالية أكبر لتداول ناجح
الملخص
The indicator assigns unique colors to each timeframe’s zones for clear, layered visualization, enabling traders to assess higher-timeframe strength alongside lower-timeframe precision. Zones are dynamically extended to the latest candle, showing active areas where price is likely to react without manual redrawing or clutter.
Each zone is visually marked with a colored rectangle, adjustable border width, and clear text labels indicating timeframe and zone type, placed to avoid overlap with price candles. This tool supports trading strategies based on market structure, liquidity, and institutional footprints, including SMC, ICT, Wyckoff, and liquidity concepts.
SystemAlgo1 is suitable for intraday scalpers and swing traders seeking automated, multi-timeframe supply and demand mapping to identify high-probability reaction points across markets such as Forex, cryptocurrencies, indices, commodities, and stocks.