
Levels
مؤشر
175 التنزيلات
الإصدار 1.0، Jan 2026
Windows, Mac

الوصف
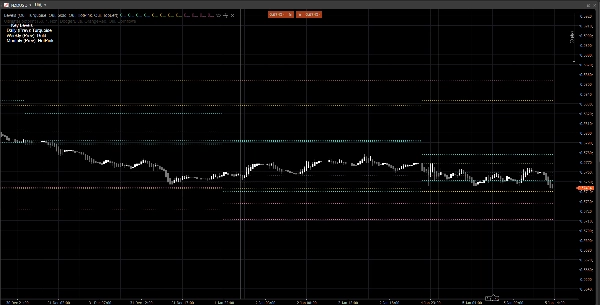
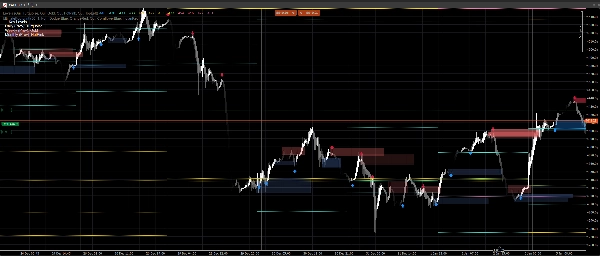
مناطق حركة السعر هو مؤشر خفيف الوزن وخالي من الضوضاء يرسم المستويات الرئيسية اليومية والأسبوعية والشهرية السابقة مباشرة على الرسم البياني الخاص بك.
يعرض:
- اليوم السابق: الأعلى / الأدنى / الافتتاح / الإغلاق
- الأسبوع السابق: الأعلى / الأدنى / الافتتاح / الإغلاق
- الشهر السابق: الأعلى / الأدنى / الافتتاح / الإغلاق
تُستخدم هذه المستويات على نطاق واسع كـ مناطق تفاعل، مراجع السيولة، و مرتكزات السياق لهياكل السوق، والدخول، والأهداف، وتحديد المخاطر.
لماذا هو مفيد
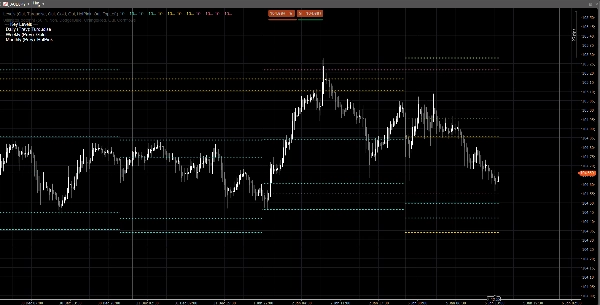
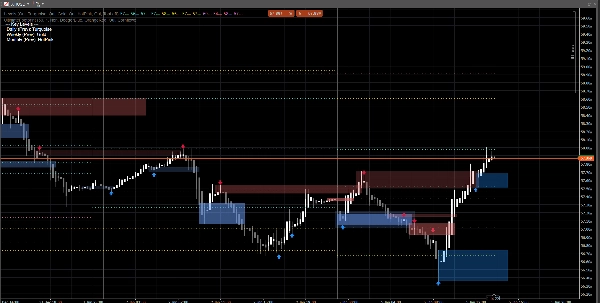
- رؤية فورية لمستويات الإطار الزمني الأعلى دون تبديل الرسوم البيانية
- يساعدك على تأطير حركة السعر داخل اليوم حول PDH/PDL، PWH/PWL، PMH/PML
- عرض بصري نظيف: تبقى المستويات ثابتة للجلسة/الأسبوع/الشهر الحالي
- يعمل على أي رمز وزمن
التخصيص
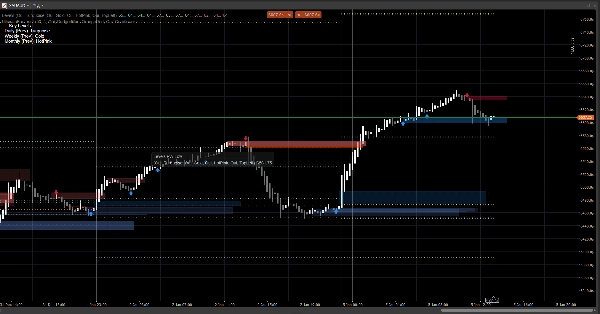
يمكنك تبديل كل إطار زمني بشكل مستقل:
- عرض اليومي / الأسبوعي / الشهري
- تعيين لون مخصص لكل مجموعة
- تمكين وسيلة إيضاح بسيطة، مع إمكانية اختيار موضع الزاوية
ملاحظات فنية
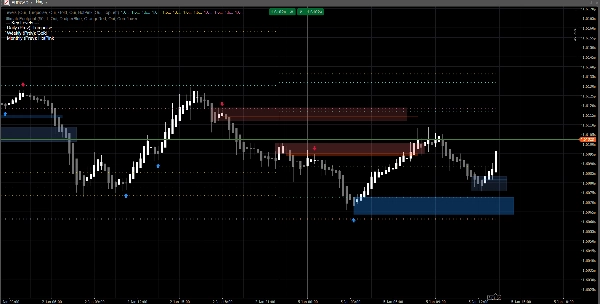
- يتم حساب المستويات باستخدام الشمعة اليومية/الأسبوعية/الشهرية المكتملة السابقة (وليس الشمعة الحالية المتشكلة).
- هذا يمنع إعادة الرسم ويحافظ على ثبات المستويات خلال الجلسة.
إخلاء المسؤولية
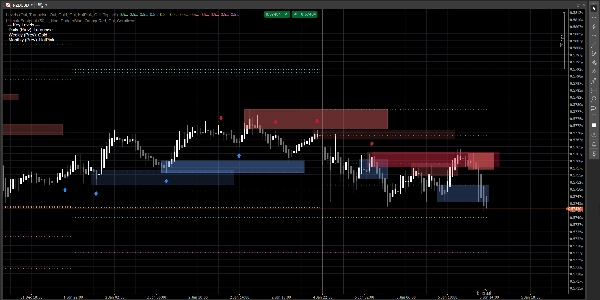
يتم توفير هذا المؤشر لأغراض الرسم البياني ودعم القرار فقط. لا يولد إشارات شراء/بيع ولا يعد نصيحة مالية. قم دائمًا بإدارة المخاطر والتحقق من بياناتك الخاصة.
الإشارات على الرسم البياني يتم توليدها بواسطة مؤشر Ultimate Footprint المتوفر في ملفي الشخصي.
الملخص
ملف تعريف المؤشر
تقييمات العملاء
0.0
التقييمات: 0
تقييمات العملاء
لا توجد تقييمات لهذا المنتج حتى الآن. هل جرَّبته بالفعل؟ كن أول من يخبر الآخرين!
مناقشة
الأسئلة الشائعة
Prop
Forex
Indices
Commodities
Crypto
Stocks
يتم توفير المنتجات المتاحة من خلال cTrader Store، بما في ذلك روبوتات التداول والمؤشرات والإضافات، من قبل مطوري الطرف الثالث وإتاحتها لأغراض الوصول المعلوماتي والفني فقط. cTrader Store ليس وسيطًا ولا يقدم نصائح استثمارية أو توصيات شخصية أو أي ضمان للأداء المستقبلي.


السعر
منذ 23/07/2025
6.91M
حجم التداول
27.63K
الربح بالبيب
877
التثبيتات المجانية