説明
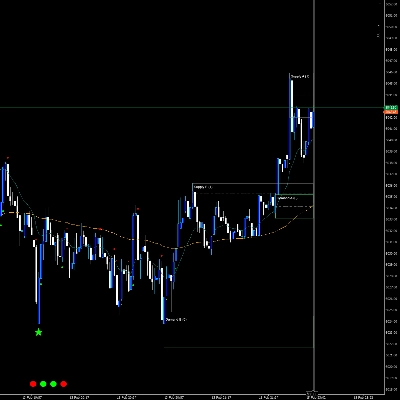
cTrader向けのコンパクトなスキャルピングインジケーターで、1つのクリーンなオーバーレイに3つの要素を組み合わせています:セッションベースの日次VWAP、オープニングレンジガイド、「デルタ/パワー」バブル(モメンタム/アクティビティマーカー)、動的な需給ゾーン(テスト/確認ステータス付き)とオプションのトレンドフィルター。さらに、複数の時間枠で直近にクローズしたローソク足の方向を一目で示すマルチタイムフレームの信号機(VWAP+オープニングレンジ)も含まれています。
注意: パラメーターは、市場や時間枠に素早く適応できるよう意図的に設計されており、ロジックはバックグラウンドで自動的に動作します。
提供されるもの(機能)
- 日次VWAP(毎取引日リセット):公正な「セッション価格」を視覚化し、平均回帰、プルバック、方向性バイアスに役立ちます
- オープニングレンジ(OR)高値/安値:オープニングレンジを描画し、ブレイクアウト/リバーサルのセットアップを構築できます(自動または手動で定義された分数)
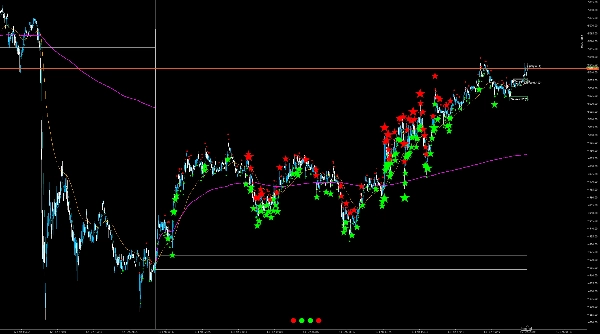
- デルタ/パワーバブル:平均以上のアクティビティを持つローソク足を強調表示(モードにより:ボリュームスパイク、レンジ/ボディボリューム、またはデルタの代理指標)し、方向(強気/弱気)で色分けします
- 需給ゾーン(2つのピボットセットA/B):確認済みのピボット高値/安値から自動生成され、ATRベースのゾーン深さ、定義された右側の拡張、およびオプションのミッドラインを備えています
- ゾーンステータス:「新規 → テスト済み → 確認済み」(確認はオプションでボリューム条件による)により、ゾーンがすでに取引されたかどうか、強さを持って反応したかを即座に確認できます
- トレンドフィルター(オプション):EMAまたはEMA+ADXフィルターにより、ゾーンはトレンド方向にのみ表示/考慮されます(例:上昇トレンド時のみ需給ゾーンを表示)
- マルチTF信号機:M1/M5/H1/D1を最後にクローズしたローソク足に応じて緑/赤/灰色で表示し、チャートの時間枠を切り替えずに有用なコンテキストを提供します
購入者が設定可能な内容(パラメーター概要)
設定はグループ化され、意図的に実用的にまとめられています:
コア
- ATR長さ:ゾーン深さおよび一部のバブルメトリクスの基礎入力
- 日次VWAP表示:オン/オフ
- オープニングレンジ表示:オン/オフ
- ORモード:自動(チャートTFに依存)または手動(固定分数)
- OR自動係数 / OR分数:ORの期間を微調整
トレンドフィルター
- モード:オフ / EMA / EMA+ADX
- EMA高速 / EMA低速:EMAクロス/関係によるトレンド方向
- ADX長さ+閾値:EMA+ADX有効時の最小トレンド強度
- EMAライン表示:フィルターEMAをチャートにオプションで表示
バブル
- バブル表示:オン/オフ
- デルタ代理指標:3種類(レンジ加重、前回との終値比較、始値との終値比較)で、銘柄/フィードに依存
- バブルメトリクス:自動または固定メトリクス(絶対デルタ、ボリュームスパイク、ボディ/レンジボリューム)
- 分位数の遡及期間+分位数%:バブル信号の「希少度」を制御(%が高いほど強いイベントのみ)
- ラベル制限:チャート上に残るバブルラベルの数(パフォーマンス/明瞭さ)
- 基本フォント+4Kモード:高解像度ディスプレイ向けの視覚的スケーリング
- グリフ小/大:バブル形状(点/円など)
- デバッグ:バブルを強制表示(テスト用のみ)
ゾーン
- ゾーン表示:オン/オフ
- ゾーン深さ×ATR:ゾーンの厚さ(ボラティリティ適応型)
- 拡張(バー数):ゾーンが右方向にどれだけ伸びるか
- ミッドライン表示:オン/オフ
- トレンド内ゾーンのみ:トレンドフィルターの方向と一致する場合のみゾーンを表示
- ピボットパラメーターA&B(左/右):2つの感度(例:「粗い」+「細かい」ゾーン)
- ゾーンラベルサイズ:小/中/大
- 色(ARGB):需給、テスト済み、確認済み+ミッドラインの個別色
- ボリューム+ボリュームMA/乗数による確認:ティックボリュームがMA×係数を超えた場合のみ確認
信号機
- 信号機表示:オン/オフ
- フォント+4Kスケール:サイズ/読みやすさ
- Nバーごとに更新:更新頻度(パフォーマンスと応答性のバランス)
(パラメーターのフィールド説明はParameter属性/説明を通じてきれいに表示可能;プラットフォームはパラメーターUI内でのグループ化と説明を直接サポートしています。)
対象ユーザー
- 迅速なコンテキストが必要なスキャルパーおよび日中トレーダー:構造のためのVWAP/OR、「アクティビティ」のためのバブル、反応エリアのためのゾーン
- 複数のインジケーターを重ねずに明確な視覚化を求めるトレーダー
- コアをプラグアンドプレイ表示として維持しつつ、オプションのトレンドフィルター表示(EMA/ADX)を望むユーザー
典型的な使用法(短く実用的)
VWAP+信号機でバイアスを確認し、オープニングフェーズ中の「戦闘ゾーン」としてORを使用します。
バブルを「ここで平均以上の何かが起きている」(ブレイクアウト、吸収、インパルス)の手がかりとして使用します。
ゾーンを計画エリアとして使用:最初の接触=「テスト済み」;高ボリュームでの反応は「確認済み」とマーク可能;ミッドラインはレベル間のクリーントレードに役立ちます。
概要
インジケーターのプロフィール
カスタマーレビュー
0.0
レビュー: 0
カスタマーレビュー
この商品にはまだレビューがありません。お使いになったことがある方は、ぜひレビューをお願いします。
ディスカッション
よくあるご質問
Prop
Forex
Signal
Breakout
Scalping
Indices
Commodities
Crypto
Stocks
cTrader Storeで入手可能な取引ボット、インジケーター、プラグインなどの商品は、第三者の開発者が提供するものであり、情報と技術の取得のみを目的としてご利用いただけます。cTrader Storeはブローカーではなく、投資助言や個人的な推奨を行うことも、将来のパフォーマンスを保証することもありません。
この作成者の他の商品

これも好きかも


![「Wyckoff Toolkit [Iridio Capital]」ロゴ](https://cdn.ctrader.com/image/webp/8acfe6a1-6a8e-4578-9367-9df3af2b1801_27763)


価格
登録日 10/01/2026
6
販売