
SMC
Indicador
179 transferências
Versão 1.0, Feb 2026
Windows, Mac
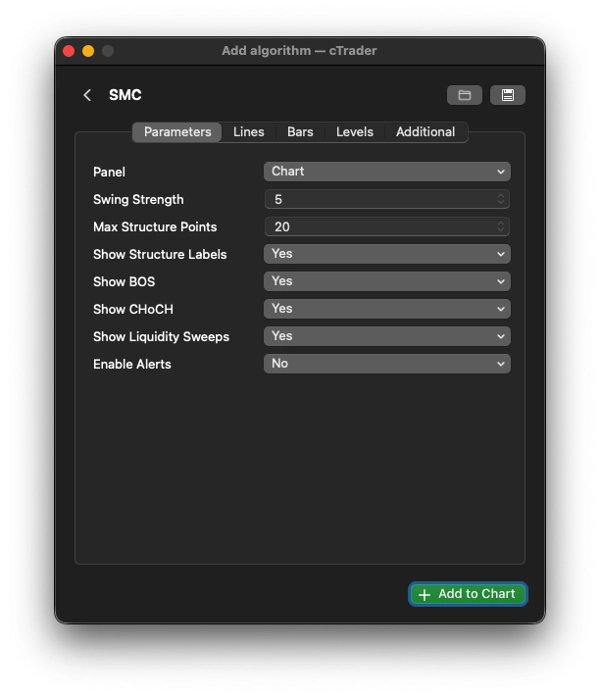
Resumo da lógica principal – como decide o que é o quê
- Detecta swings usando a lógica clássica de fractais (barras SwingStrength à esquerda + direita)
-
- Padrão = 5 → swings razoavelmente limpos na maioria dos intervalos de tempo
- Determina a tendência a partir dos últimos dois máximos + últimos dois mínimos:
-
- HH + HL → Tendência de alta
- LH + LL → Tendência de baixa
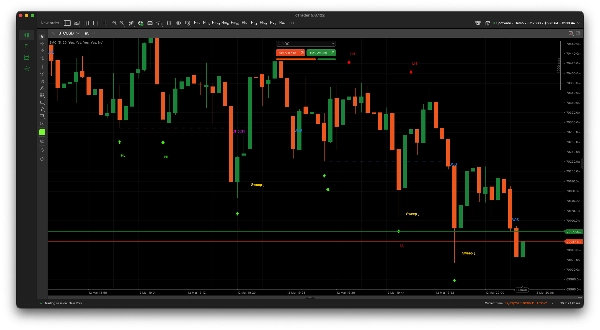
- Detecção de BOS / CHoCH (no fechamento):
-
- Fechamento > último swing high
-
- Se a tendência era de alta → BOS (continuação)
- Se a tendência era de baixa → CHoCH (reversão potencial)
- Fechamento < último swing low → lógica oposta
- Varredura de liquidez (padrão SMC muito comum):
-
- Pavio alto acima do último swing high mas fechamento abaixo dele → varredura de alta (provável falso rompimento para cima)
- Pavio baixo abaixo do último swing low mas fechamento acima dele → varredura de baixa
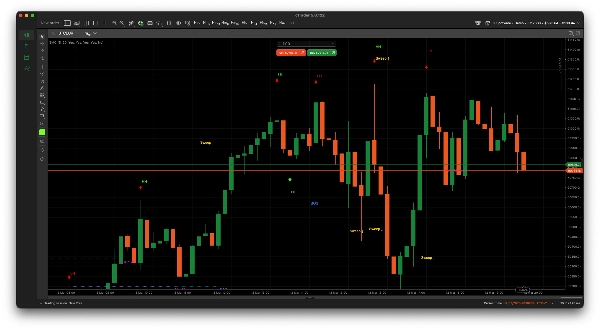
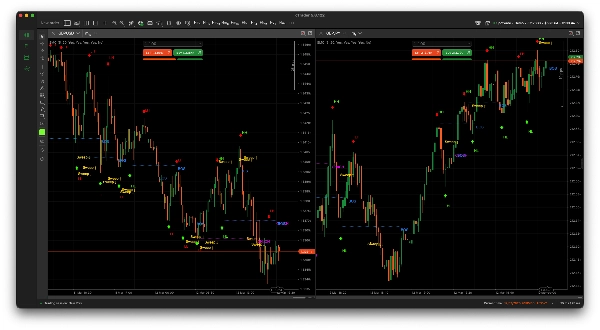
Uso típico do indicador em negociações SMC
- Procure por CHoCH + varredura de liquidez na direção oposta → configurações de reversão antecipada
- Negocie na direção do BOS após um pullback / varredura
- Evite negociar contra a estrutura mostrada pelas etiquetas HH/HL vs LH/LL
- Muitos traders esperam por varredura → sequências de confirmação CHoCH/BOS
Perfil do indicador
0.0
Avaliações: 0
Avaliações de clientes
Ainda não há avaliações para este produto. Já o experimentou? Seja o primeiro a contar a outras pessoas!
BTCUSD
Forex
Breakout
Indices
EURUSD
Commodities
GBPUSD
NZDUSD
RSI
Prop
ZigZag
Scalping
Fair Value Gap
SMC
Crypto
Stocks
XAUUSD
NAS100
USDJPY
Os produtos disponíveis através da cTrader Store, incluindo bots de negociação, indicadores e plugins, são fornecidos por programadores terceiros e são disponibilizados apenas para fins informativos e de acesso técnico. A cTrader Store não é um corretor e não fornece aconselhamento em matéria de investimento, recomendações pessoais ou qualquer garantia de desempenho no futuro.
Mais deste autor


Desde 01/12/2025
179
Instalações gratuitas