شعار "Heatmap Volume"
مؤشر
الإصدار 1.0، Mar 2026
Windows, Mac
5.0
التقييمات: 2
صورة "Heatmap Volume" المحملة
منذ 04/03/2026
2
المبيعات

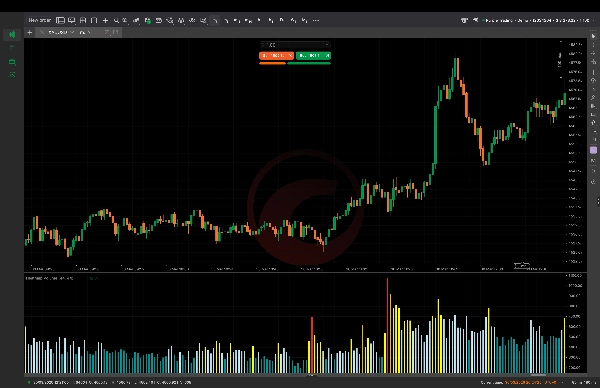
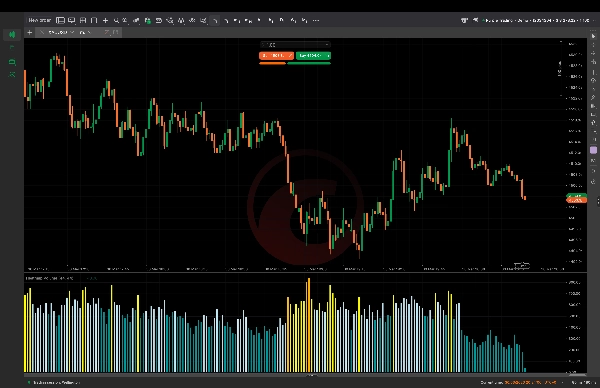
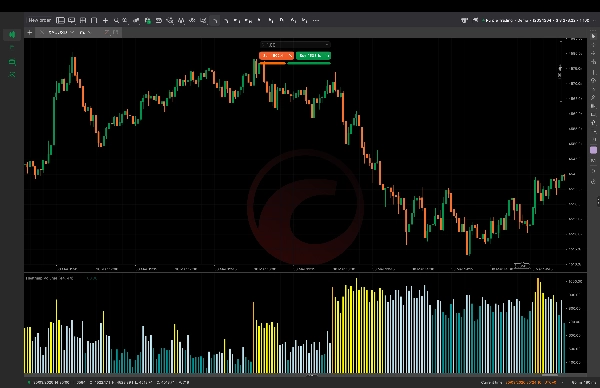
حجم خريطة الحرارة هو مؤشر تداول قوي مصمم لكشف النشاط الحقيقي وراء تحركات السعر من خلال تحليل الحجم عبر الانحراف الإحصائي (درجة Z). بدلاً من الاعتماد فقط على السعر، يظهر متى يكون الحجم مرتفعًا أو منخفضًا بشكل غير عادي مقارنة بمتوسطه—مساعدتك على تحديد مشاركة الأموال الذكية بوضوح.

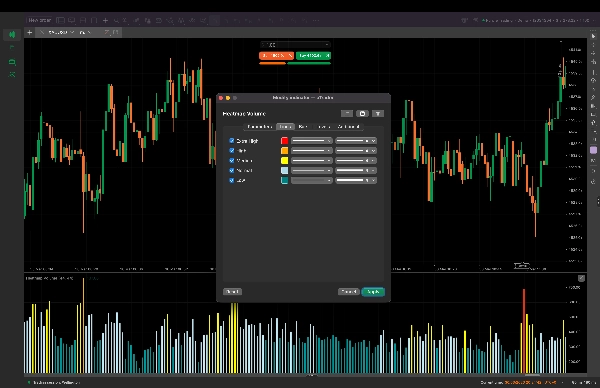
يتيح هذا للمتداولين اكتشاف المشاركة المؤسسية على الفور، والزخم القوي، والفخاخ المحتملة. تبرز مناطق الحجم العالي (الأصفر، البرتقالي، الأحمر) المناطق التي يكون فيها اللاعبون الكبار نشطين، مما يساعد على تأكيد الاختراقات، والانعكاسات، واستمرار الاتجاه. تشير مناطق الحجم المنخفض (الأزرق، الأزرق المخضر) إلى تحركات ضعيفة، أو سيولة منخفضة، أو اختراقات زائفة—مثالية لتجنب الصفقات السيئة.

إنه فعال بشكل خاص للتداول السريع والتداول اليومي، حيث تكون القرارات السريعة والدقيقة مهمة. عند دمجه مع أدوات الاتجاه مثل EMA 44، يصبح نظامًا كاملاً لتصفية الصفقات ذات الاحتمالية العالية وتجنب ضوضاء السوق.

🔥 الفوائد الرئيسية:

  • تمييز التحركات الحقيقية من الزائفة بوضوح
  • كشف نشاط المؤسسات (الأموال الذكية)
  • تأكيد الاختراقات القوية واستمرار الاتجاه
  • تجنب الفخاخ ذات الحجم المنخفض والإشارات الزائفة
  • تصفية الأسواق الجانبية (المحدودة النطاق) بسهولة
  • التركيز فقط على ظروف السوق المتجهة
  • تحسين توقيت الدخول ودقة التداول
  • تقليل الإفراط في التداول في الظروف المتقلبة
  • يعمل بشكل مثالي مع استراتيجيات تعتمد على EMA
  • خريطة حرارة بصرية نظيفة لاتخاذ القرار الفوري

سواء كنت متداولًا سريعًا أو متداولًا يوميًا، يمنحك حجم خريطة الحرارة ميزة واضحة من خلال مساعدتك على التداول فقط عندما يكون للسوق قوة حقيقية—مبقيًا إياك بعيدًا عن ضوضاء السوق الجانبية وداخل الاتجاهات القوية.

ملف تعريف المؤشر
فئة المؤشر
الحجم
نوع المخرجات
التصور
فلتر
متطلبات البيانات
الحجم
الإشارات المدعومة
الانقطاع
التباين
قوة الاتجاه
التقلب
لمس المستوى
كسر المستوى
5.0
التقييمات: 2
5
100 %
4
0 %
3
0 %
2
0 %
1
0 %
تقييمات العملاء
April 10, 2026
pretty decent as a helper. Not perfect, but it made volume based context easier to read and Better results come from testing it for a few more sessions.
April 3, 2026
This belongs in the review stack for volume based context. A sample of 26 setups on Asian session should show whether it really improves the routine.
BTCUSD
Forex
Breakout
Indices
EURUSD
Commodities
GBPUSD
NZDUSD
Prop
Scalping
SMC
Crypto
Stocks
XAUUSD
NAS100
USDJPY
يتم توفير المنتجات المتاحة من خلال cTrader Store، بما في ذلك روبوتات التداول والمؤشرات والإضافات، من قبل مطوري الطرف الثالث وإتاحتها لأغراض الوصول المعلوماتي والفني فقط. cTrader Store ليس وسيطًا ولا يقدم نصائح استثمارية أو توصيات شخصية أو أي ضمان للأداء المستقبلي.

المزيد من هذا المؤلف

مؤشر
SMC
Forex
+5
Detects Break of Structure (BOS) and Change of Character (CHOCH)
مؤشر
RSI
SMC
+17
Turn WaveTrend Cross into a BTC profit machine precise buy sell signals, smart momentum edge, no lag trading system
مؤشر
SMC
Prop
+16
Auto support-resistance + buy/sell signals! Catch breakouts early & never miss high-probability trades again 🚀📈
مؤشر
ATR
RSI
+17
🔥 Smart candles + Buy/Sell arrows! Catch trends, avoid sideways, and trade with precision like a pro!
مؤشر
SMC
Prop
+14
Spot smart money instantly! Heatmap Volume Candles reveal real moves, avoid traps, and catch explosive trends early 🔥
مؤشر
Prop
Forex
+11
Advanced EMA indicator with dynamic color trend, slope strength & smart filters for clean, high-probability trading sign

قد يعجبك أيضًا

مؤشر
VWAP
Fibonacci
+5
Market Blueprint - Unified Into One Clean Trading Framework
مؤشر
Volume
FSP_CumulativeDelta
مؤشر
Imbalance
Key Levels
+2
A Next-Generation Adaptive Oscillator with Z-Score Regime Engine.
مؤشر
EMA
MACD
+1
The EWO is used to identify trading trends and opportunities in the financial markets.
مؤشر
AI
ATR
+5
🦅 AI Institutional System: Order Blocks, Volume Delta Profile, OrderFlow Limit Buy/Sell, MTF, psychology & reversal.
مؤشر
Smart Signal Reversal Trend + Patterns
مؤشر
Key Levels
Supertrend
+1
A cTrader indicator for clear trend direction, entry timing, and on-chart risk visualization.
مؤشر
ATR
BOS
+5
Sniper Edge: Multi-timeframe (M5-H1) cTrader indicator with winrate dashboard & multi-asset alerts (Gold, BTC).
مؤشر
AI
ATR
+18
Advanced Level 2 market analysis tool.
مؤشر
ATR
SMC
+20
Session boxes, liquidity sweeps and higher‑timeframe levels for intraday trading
مؤشر
Forex
Signal
+1
Great signal indicator, works with bollinger bands and heikin ashi candles! one of our latest innovations!
مؤشر
Volume
Key Levels
+1
Tape Reading indicator ,book and flow analysis
مؤشر
ADX
ATR
+5
Dynamic Fib S/R Zones – Auto body-based support/resistance. Clean, fast, decision-ready levels.
مؤشر
Forex
Crypto
+5
ICT Order Block Advanced
مؤشر
ATR
Forex
+3
Order Block - Market Structure Signals - This is one of the main indicators in the Market Structure trading system
شعار "VA Footprint"
الأعلى تقييمًا
4.5
(4)
$50
/
$75
مؤشر
SMC
Prop
+4
VA Footprint is HFT resistant, order flow chart that measures the true intent by every price level.
مؤشر
Prop
Forex
+15
Footprint volume indicator showing bid/ask splits at each price level
مؤشر
ATR
EMA
+4
The FULL-MARKET-VIEW-DASHBOARD is a professional-grade trading suite for cTrader that eliminates market noise.
منذ 04/03/2026
2
المبيعات