present
新規登録で初回購入時に$50オフ
Trading product for Supply Demand Detector インジケーター Supply & Demand, image 1
Supply Demand Detector
インジケーター
1 ダウンロード数
バージョン 1.0、May 2026
Windows、Mac
Trading product for Supply Demand Detector インジケーター Supply & Demand, image 2
Trading product for Supply Demand Detector インジケーター Supply & Demand, image 3
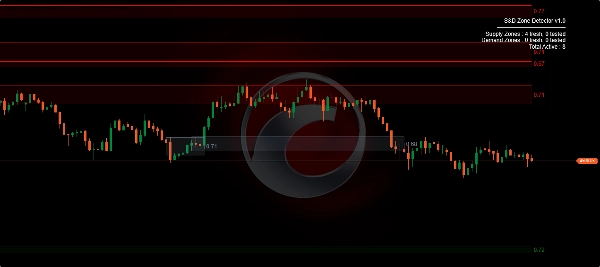
Trading product for Supply Demand Detector インジケーター Supply & Demand, image 4
登録日 13/05/2026
1
無料インストール

説明

How the Supply & Demand Zone Detector works:

1. Impulse Detection (Finding Institutional Activity)

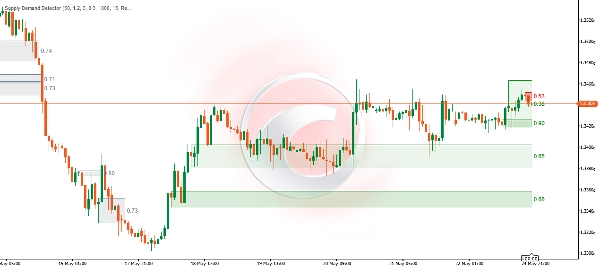
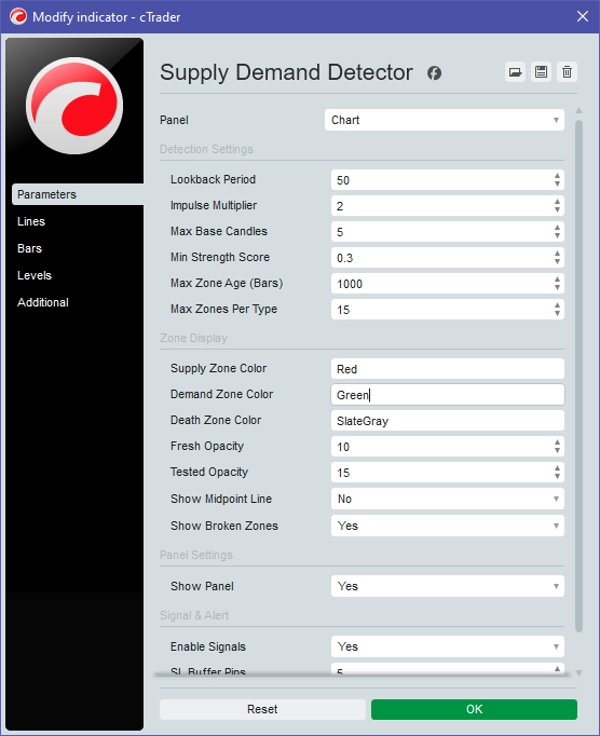
The algorithm continuously calculates the average body size of the last 50 candles (adjustable via Lookback Period). When it detects a candle that is significantly larger than this average (controlled by the Impulse Multiplier, default 1.2x), it flags it as an Impulse Candle.

  • Bullish Impulse: Indicates institutional buying. Forms a Demand Zone.
  • Bearish Impulse: Indicates institutional selling. Forms a Supply Zone.

2. Base Identification (Drawing the Zone)

Once an impulse is detected, the indicator looks backward to find a cluster of small candles (body size < 50% of the average) immediately preceding the impulse. These are the Base Candles.

  • The Top of the zone is the highest high of these base candles.
  • The Bottom of the zone is the lowest low of these base candles.

3. Strength Scoring

The indicator calculates a strength score (from 0.00 to 1.00) based on three factors:

  1. Impulse Size: How massive the breakout candle is.
  2. Post-Move: How far the price traveled immediately after the breakout.
  3. Base Density: Fewer base candles mean a faster, more aggressive institutional reaction (higher score).
    This score is printed inside the far-right edge of the zone box.

4. Zone Lifecycle & The "Death" Mechanic

As live price moves, the indicator updates the status of the zones in real-time:

  • Fresh (Untouched): The zone is newly formed and highly valid. The box automatically stretches to the right, following the current live candle.
  • Tested: Price touches the zone but does not break it. Generates a Signal Arrow (Buy/Sell) on the chart.
  • Mitigated: Price penetrates more than 50% deep into the zone. The zone is weakening.
  • Broken (Death Zone): If a candle completely closes beyond the zone's opposite boundary (e.g., closes below a Demand Zone), the zone is invalidated.
    • The visual reaction: The zone immediately stops stretching to the right (anchored to the DeathTime), and its color turns into a faded Slate Gray (Death Color) to show it is no longer active.

5. Multi-Overlap Filter

To prevent the chart from becoming heavily cluttered, the indicator checks for overlapping zones. If a newly detected zone overlaps more than 70% with an existing older zone of the same type, the new zone is ignored.

概要

AI summary
The Supply Demand Detector is a trading indicator designed to identify supply and demand zones by detecting institutional impulsive price moves. It operates by continuously calculating the average body size of recent candles and flags significantly larger candles as impulse candles, distinguishing between bullish impulses (demand zones) and bearish impulses (supply zones).

After detecting an impulse, the indicator identifies a cluster of smaller preceding candles called base candles, using their highest high and lowest low to define the zone boundaries. It assigns a strength score (0.00 to 1.00) to each zone based on impulse size, subsequent price movement, and base candle density, which is displayed on the chart.

The indicator tracks the lifecycle of zones in real-time, categorizing them as fresh, tested (with buy/sell signal arrows), mitigated, or broken (invalidated), with visual cues such as color changes and zone stretching adjustments. To reduce chart clutter, it filters out new zones that overlap more than 70% with existing zones of the same type.

This tool supports visualization of market structure through supply and demand zones, aiding traders in identifying potential reversal points based on institutional activity.
インジケーターのプロフィール
インジケーターのカテゴリー
市場構造(SMC)
出力の種類
ビジュアル表示
データ要件
バーのみ
サポート対象のシグナル
反転

カスタマーレビュー

0.0
レビュー: 0
カスタマーレビュー
この商品にはまだレビューがありません。お使いになったことがある方は、ぜひレビューをお願いします。

ディスカッション

よくあるご質問

Supply & Demand
cTrader Storeで入手可能な取引ボット、インジケーター、プラグインなどの商品は、第三者の開発者が提供するものであり、情報と技術の取得のみを目的としてご利用いただけます。cTrader Storeはブローカーではなく、投資助言や個人的な推奨を行うことも、将来のパフォーマンスを保証することもありません。

この作成者の他の商品

インジケーター
BOS
CHOCH
+3
Shows market structure (BoS/CHoCH) and key zones (OB/FVG) to help traders spot high-probability trade setups.
インジケーター
Risk Dashboard
AI-powered daily range forecasts help traders spot volatility opportunities and plan stops and targets.

これも好きかも

インジケーター
Signal
🔹 Trend-Reversal-Indicator for cTrader 🔹 The ultimate Renko chart tool!
インジケーター
Key Levels
Order Block
+5
Order blocks, fair value gaps, liquidity sweeps and a 24-timeframe signal scanner on one chart.
インジケーター
CHOCH
Inducement
+5
TradeLens - Frame the Trade. Refine the Entry. Two Timeframes. One Decision.
インジケーター
RSI
RSI on the main chart with 45/55 momentum levels, overbought/oversold levels, averaged RSI, and multi-timeframe support.
インジケーター
ATR
RSI
+4
RSI bands drawn on price, confluence-scored BUY/SELL signals, an ATR stop with three targets
インジケーター
SMC
Forex
+5
Silver Bullet by LudwigICT
インジケーター
ATR
RSI
+17
Turn data into precision trades with AlphaTrend Pro Max — advanced trend, signal & structure analysis in one.
インジケーター
ZigZag
Indices
+2
Auto Trendlines, Fibonacci, Pitchfork and Patterns from non‑repainting pivots. One‑click Presets, targeted Alerts, and a
インジケーター
Imbalance
Fair Value Gap
+1
Multi-symbol, multi-timeframe Fair Value Gaps in one panel.
インジケーター
Forex
Crypto
+3
PnL dashboard with per‑asset exposure, win‑rate, and spread % with dynamic colors.
インジケーター
AI
ATR
+10
FX Sniper: Multi-pair Forex analysis tool. Features trend logic, adaptive pivots, and momentum filtering for major pairs
インジケーター
ATR
RSI
+24
Daily moving averages, simplified. Displays 3 daily moving averages on lower timeframes with selectable MA types.
インジケーター
SMC
Prop
+4
📈 Trading Sessions Indicator — London, New York & Tokyo Visualize Key Market Sessions + High/Low Levels with Precision
インジケーター
implifies market analysis by automatically identifying bullish 🚀 or bearish 🐻 phases and marking key levels where ....
インジケーター
RSI
MACD
+1
Precision Supply & Demand zones indicator—automatically plots key buy/sell areas on your chart for smarter entries.
インジケーター
ATR
RSI
+6
🔍 MultiScalpScorePRO – Powerful real-time scoring system combining indicators for ultra-precise scalping signals.
インジケーター
ATR
Forex
+3
LevelMaster S/R: Pinpoint key support & resistance zones with precision. Perfect for traders of all levels Trade smarter
インジケーター
MultiTF Pivot and SR Indicator

価格

登録日 13/05/2026
1
無料インストール