الوصف
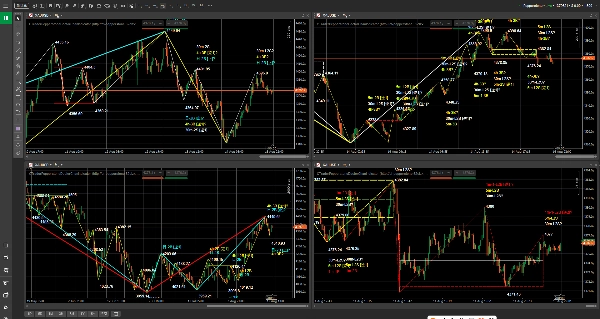
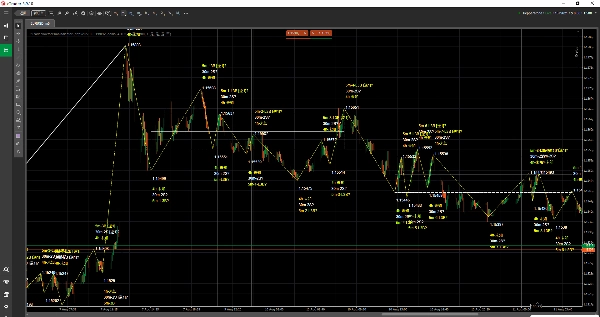
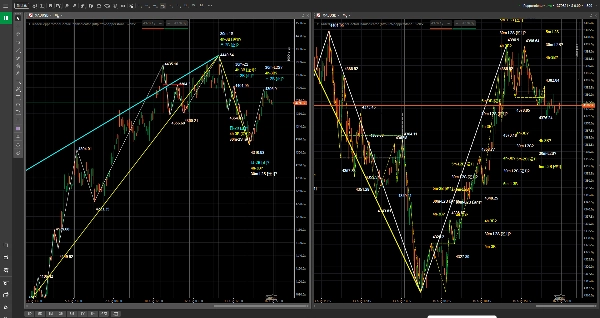
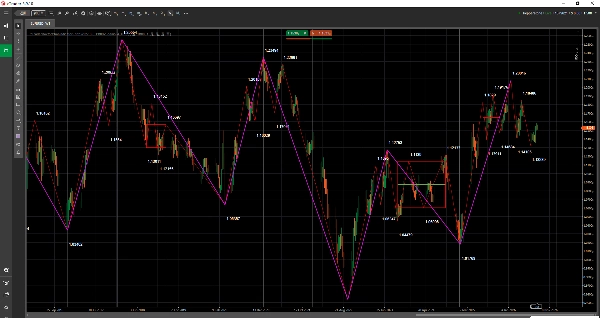
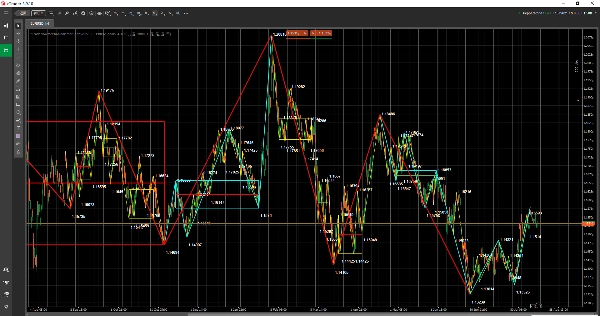
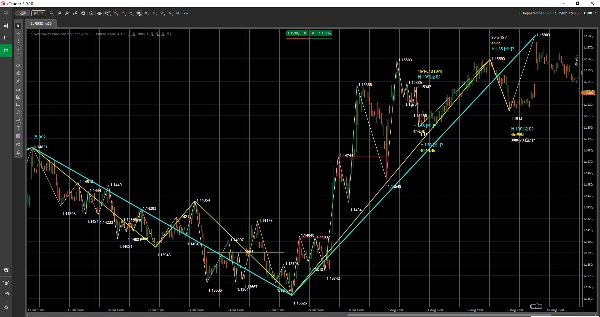
مؤشر هيكل بوشي تشانلون لـ cTrader هو مؤشر تحليل فني لهيكل السوق / تراكب الرسم البياني يُستخدم لعرض هياكل تشانلون على مخططات cTrader.
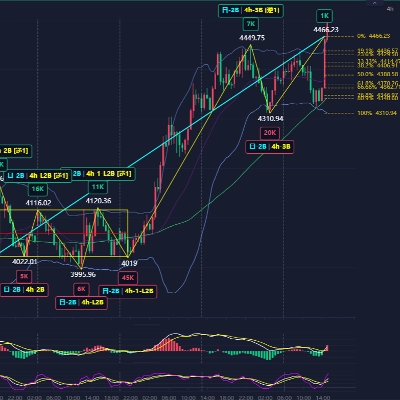
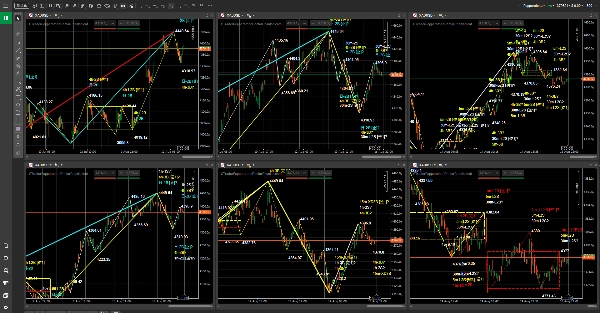
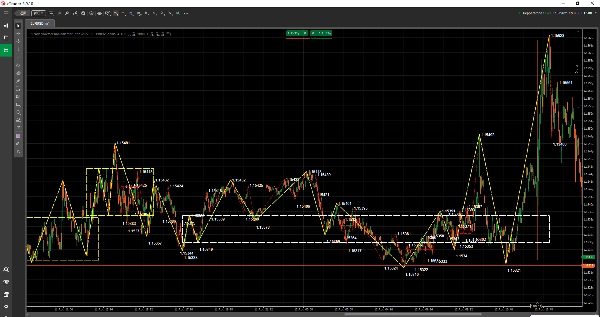
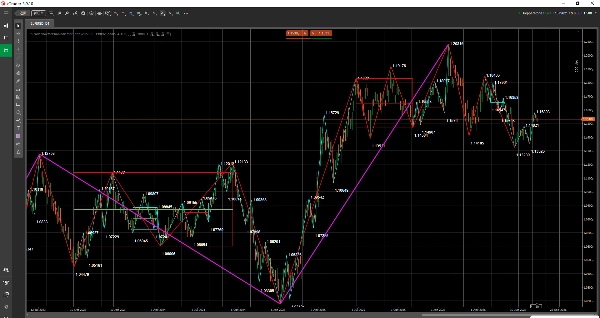
يناسب المتداولين الذين يركزون على حركة السعر، هيكل الاتجاه والتحليل متعدد الأطر الزمنية. يعرض المؤشر هياكل تشانلون الرئيسية ككائنات على المخطط، بما في ذلك هياكل Bi، مناطق Zhongshu، علامات الشراء/البيع والمزيد، مما يساعد المستخدمين على ملاحظة إيقاع السوق، التغيرات الهيكلية والعلاقات بين الأطر الزمنية المختلفة بشكل أكثر بديهية.
هذا المؤشر ليس روبوت تداول آلي وليس خدمة إشارات تداول. الغرض منه هو مساعدة المستخدمين على قراءة المخططات، مراجعة الأسواق وبناء خطط تداول بشكل أوضح.
الإصدار الحالي متوافق مع رموز وأطر زمنية محددة من Pepperstone cTrader. هذا المنتج هو مؤشر طرف ثالث مستقل وليس منتجًا رسميًا من Pepperstone أو منتج شريك لـ Pepperstone.
نظرة عامة على المؤشر
- نوع المؤشر: مؤشر هيكل السوق / تراكب الرسم البياني.
- الأدوات المفضلة: رموز الفوركس، المؤشرات، السلع، العملات المشفرة وعقود الفروقات للأسهم المحددة في Pepperstone cTrader.
- الأطر الزمنية المفضلة: دقيقة واحدة، 5 دقائق، 15 دقيقة، 30 دقيقة، ساعة واحدة، 4 ساعات، يومي، أسبوعي وشهري.
- حالة الاستخدام في التداول: مراقبة هيكل المخطط، التحليل متعدد الأطر الزمنية، إعداد خطة التداول ودعم المراجعة.
ما يمكنك رؤيته على المخطط
- هياكل Bi: تُستخدم لمراقبة إيقاع التأرجح والتقدم الهيكلي.
- مناطق Zhongshu: تُستخدم لمراقبة مناطق التوحيد المهمة، التوازن والتداخل الهيكلي.
- علامات الشراء/البيع: تُستخدم للمساعدة في تحديد نقاط المرجع الهيكلية الرئيسية.
- تسميات نصية، خطوط أفقية، خطوط عمودية، مناطق مستطيلة، خطوط اتجاه وكائنات مخطط أخرى.
- يدعم المطابقة التلقائية للبيانات مع الإطار الزمني الحالي للمخطط بشكل افتراضي، مما يسهل المراقبة متعددة الأطر الزمنية.
لمن هذا المؤشر
- المستخدمون الذين يتعلمون أو يستخدمون مؤشر هيكل بوشي تشانلون وتحليل هيكل تشانلون.
- المستخدمون الذين يرغبون في عرض معلومات الهيكل مباشرة على مخططات cTrader.
- المستخدمون الذين يستخدمون Pepperstone لعرض الفوركس، المؤشرات، السلع، العملات المشفرة أو عقود الفروقات للأسهم.
- المتداولون الذين يحتاجون إلى مقارنة هياكل الاتجاه عبر أطر زمنية مختلفة.
- المستخدمون الذين يرغبون في جعل عمليات قراءة المخطط، التخطيط والمراجعة أكثر وضوحًا.
الوصول والترخيص
يتم إدارة الوصول إلى المنتج والترخيص من خلال عملية الشراء، التجربة والتثبيت في متجر cTrader. يرجى الرجوع إلى حالة الشراء، حالة التجربة ومعلومات المنتج المعروضة على صفحة منتج متجر cTrader.
الرموز المدعومة حاليًا من Pepperstone
الفوركس:
GBPUSD, EURUSD, USDJPY, USDCHF, AUDUSD, USDCAD, GBPJPY
المؤشرات:
US500, NAS100, GER40, UK100, JPN225, VIX, HSTECH
السلع:
XAUUSD, XAGUSD
العملات المشفرة:
BTCUSD, ETHUSD
الأسهم:
AAPL.US-24, MSFT.US-24, GOOG.US-24, AMZN.US-24, TSLA.US-24, NVDA.US-24, META.US-24, NFLX.US-24, JPM.US-24
الأطر الزمنية المدعومة
دقيقة واحدة، 5 دقائق، 15 دقيقة، 30 دقيقة، ساعة واحدة، 4 ساعات، يومي، أسبوعي وشهري.
سير العمل المقترح
1. افتح مخططًا لرمز مدعوم في بيئة Pepperstone cTrader.
2. قم بتحميل مؤشر هيكل بوشي تشانلون على المخطط.
3. وقت بيانات مؤشر هيكل بوشي تشانلون هو UTC+0. عند التحقق من هياكل المخطط، تأكد من تغيير المنطقة الزمنية لمخطط cTrader إلى المنطقة الزمنية المقابلة قبل مقارنة المواقع.
4. تأكد من أن الإطار الزمني الحالي للمخطط مدعوم. يقوم المؤشر بمطابقة البيانات تلقائيًا مع إطار المخطط الزمني.
5. قم بتشغيل أو إيقاف "عرض Bi"، "عرض Zhongshu" و"عرض الشراء/البيع" حسب الحاجة.
6. راقب هيكل المخطط مع خطة التداول الخاصة بك، إدارة المراكز والسيطرة على المخاطر.
إعدادات المعلمات
الإصدار الحالي يعرض فقط 3 معلمات مرئية في لوحة مؤشرات cTrader. يتم إدارة إطار بيانات الوقت، لاحقة رمز الوسيط، التخزين المؤقت، التحديث، النقل المضغوط وإعدادات التسجيل داخليًا بواسطة المؤشر ولا تحتاج إلى تكوين للاستخدام العادي.
عرض Bi
القيمة الافتراضية: "true"
هل يتم عرض هياكل Bi.
عرض Zhongshu
القيمة الافتراضية: "true"
هل يتم عرض مناطق Zhongshu.
عرض الشراء/البيع
القيمة الافتراضية: "true"
هل يتم عرض علامات الشراء/البيع.
ملاحظات مهمة
- هذا المنتج هو مؤشر مساعد للتحليل الفني، وليس روبوت تداول آلي.
- المؤشر لا يقوم بوضع أوامر تلقائيًا.
- المؤشر لا يشكل نصيحة استثمارية، خدمة إشارات تداول أو ضمان ربح.
- الإصدار الحالي متوافق فقط مع رموز وأطر زمنية محددة من Pepperstone cTrader.
- وقت بيانات مؤشر هيكل بوشي تشانلون هو UTC+0. عند عرضه على مخطط cTrader، يرجى التبديل إلى المنطقة الزمنية المناسبة للمخطط قبل التحقق من مواقع الهيكل.
- يجب على المستخدمين استخدامه مع خطة التداول الخاصة بهم، إدارة المراكز، السيطرة على المخاطر والحكم المستقل.
اتجاه التحديث المستقبلي
يركز الإصدار الحالي على رموز وأطر زمنية محددة من Pepperstone cTrader. قد تستمر التحديثات المستقبلية في توسيع المزيد من الوسطاء، المزيد من تعيينات الرموز ونطاق خدمة بيانات أكثر اكتمالًا وفقًا لخطة المنتج.
تحذير المخاطر
ينطوي تداول الأسواق المالية على مخاطر. الأداء السابق لا يضمن النتائج المستقبلية. هذا المؤشر هو أداة مساعدة للتحليل الفني والتعلم فقط. لا يشكل نصيحة استثمارية، خدمة إشارات تداول أو ضمان ربح. الهياكل التاريخية لا تمثل نتائج مستقبلية. يجب على المستخدمين اختباره بالكامل في بيئة التداول الخاصة بهم واستخدامه بحذر مع قواعد إدارة المخاطر.
الملخص
Compatible with selected Forex pairs (e.g., GBPUSD, EURUSD), indices (e.g., US500, NAS100), commodities (XAUUSD, XAGUSD), cryptocurrencies (BTCUSD, ETHUSD), and major US stock CFDs (e.g., AAPL, MSFT, TSLA), it automatically matches data to the current chart timeframe. Users can toggle the display of Bi structures, Zhongshu zones, and buy/sell markers via simple parameters.
This indicator serves as a chart reading and market review assistant, not an automated trading system or signal provider. It requires users to apply their own trading plans, risk management, and judgment. Data time is based on UTC+0, so chart time zone adjustments are necessary for accurate structure positioning. Access and licensing are managed through the cTrader Store.
تقييمات العملاء
5 | 0 % | |
4 | 100 % | |
3 | 0 % | |
2 | 0 % | |
1 | 0 % |