


الوصف
يشير Flintridge Trader Pro إلى الأماكن التي أظهر فيها السعر بالفعل اتجاهه، ثم يخبرك عندما يتحول السوق في تلك الأماكن.
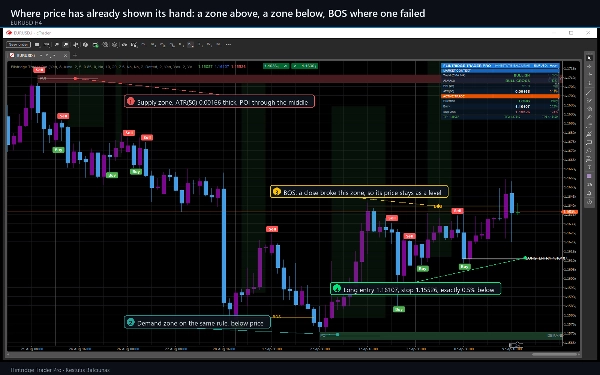
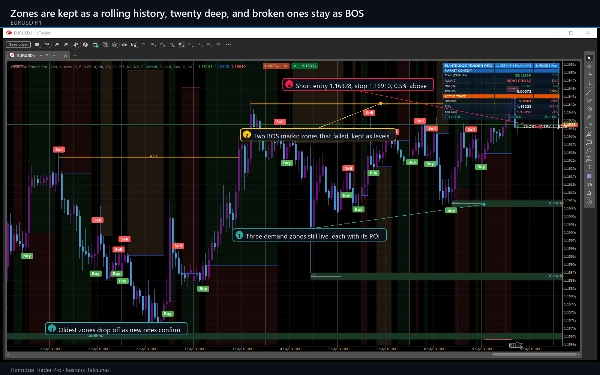
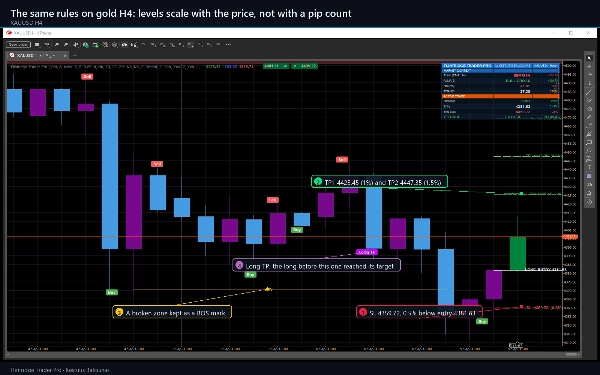
تبني نقاط التحول المؤكدة مناطق العرض والطلب، كل منها شريط بسُمك ATR مع نقطة اهتمامه في الوسط. عندما يغلق السعر من خلال منطقة، يتم تحويلها إلى كسر في الهيكل ويتم تمييزها بـ BOS، لذا يبقى المستوى الذي فشل على الرسم البياني كمعلومة بدلاً من الاختفاء. بشكل منفصل، يتم حساب المتوسط المتحرك للإغلاقات والمتوسط المتحرك للفتح على إطار زمني أعلى - ثماني مرات إطارك الزمني الافتراضي - ويكون تقاطعهما هو الإشارة.
ما يرسمه على الرسم البياني الخاص بك
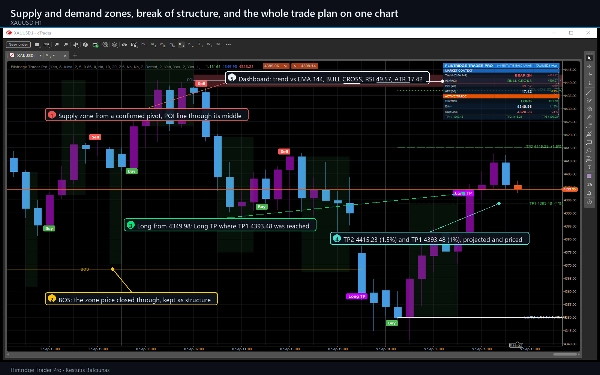
- مناطق العرض والطلب من نقاط التحول المؤكدة، كل منها مع خط POI، محفوظة كتاريخ متداول ومحوّلة إلى علامة BOS عند كسرها.
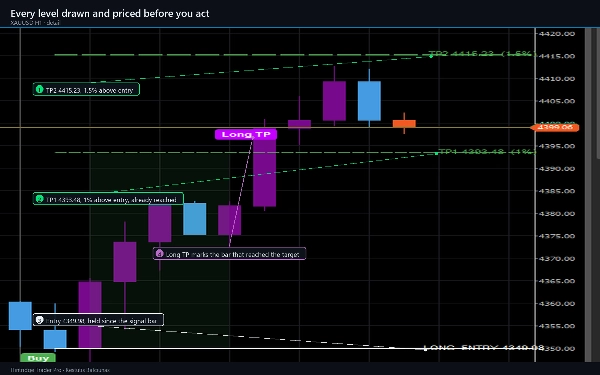
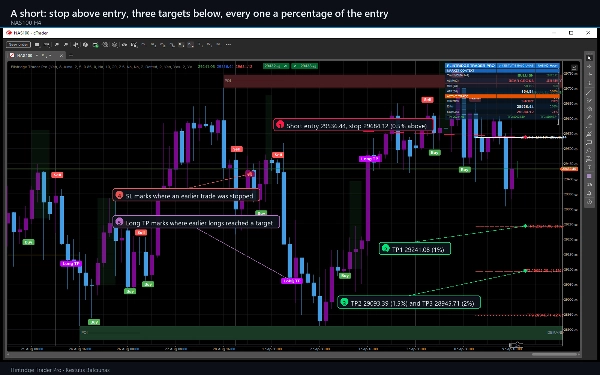
- علامات الشراء والبيع، وعلامات جني الأرباح الطويلة وإيقاف الخسارة عند الوصول إلى مستوى معين.
- الدخول، الإيقاف، والهدف الأول كخطوط متدرجة، مع شريط مخاطرة مظلل وشريط مكافأة مظلل بينهما.
- الإشارة الأخيرة معروضة للأمام، مع الدخول، الإيقاف، وجميع الأهداف الثلاثة مرسومة وموسومة بسعرها ونسبتها المئوية.
- تسميات تأرجح HH، LH، HL و LL اختيارية، وطبقة دعم ومقاومة اختيارية مع ما يصل إلى 21 مستوى ومناطقها.
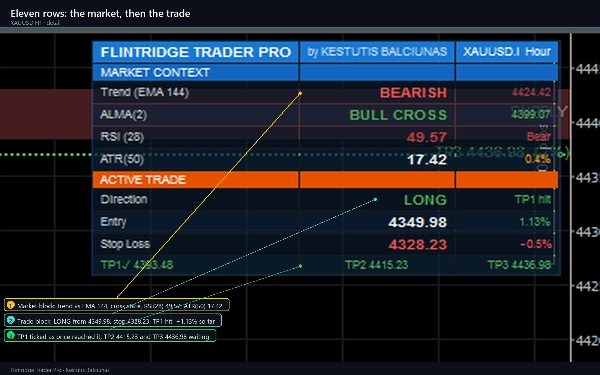
- لوحة تحكم مكونة من أحد عشر صفًا: الاتجاه مقابل EMA 144، حالة التقاطع، RSI، ATR، ثم التداول الحي مع اتجاهه، المرحلة، الدخول، الإيقاف، وثلاثة أهداف، يتم التأشير عليها عند وصول السعر إليها.
- إعادة تلوين الشموع بحيث يكون اتجاه كل شريط قابلاً للقراءة بنظرة سريعة.
كيفية التداول به
- امنحه تاريخًا. في الإعدادات الافتراضية يحتاج إلى حوالي 250 شريطًا قبل ظهور أي شيء، ويحتاج إلى بيانات كافية على الإطار الزمني الأعلى لوجود أول تقاطع.
- اقرأ المناطق أولاً. الشراء داخل منطقة الطلب والبيع داخل منطقة العرض هما الإعدادات التي تم بناء الأداة لإظهارها لك.
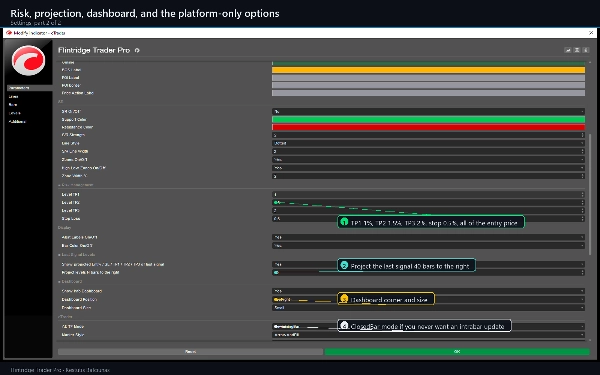
- خذ المستويات كما هي مرسومة. الإيقاف والأهداف الثلاثة هي نسب مئوية من سعر الدخول، 0.5، 1، 1.5 و 2 بشكل افتراضي، وكل واحدة منها موجودة على الرسم البياني قبل أن تتصرف.
- استخدم لوحة التحكم للسياق، وليس للإذن. الاتجاه، التقاطع، RSI و ATR تصف السوق؛ لا يمنع أي منها إشارة ما لم تقم بتشغيل المرشحات الاختيارية.
الإعدادات الأكثر أهمية
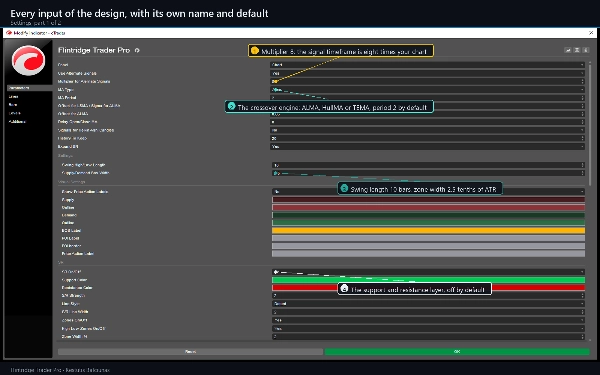
- نوع المتوسط المتحرك وفترة المتوسط المتحرك تختاران محرك التقاطع: ALMA، HullMA أو TEMA.
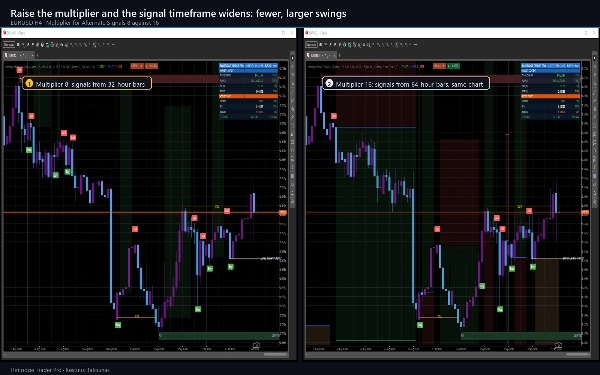
- المضاعف للإشارات البديلة يحدد مدى ارتفاع إطار الإشارة الزمني مقارنةً برسمك البياني.
- طول تأرجح القمة/القاع وعرض صندوق العرض/الطلب يتحكمان في عدد المناطق التي تحصل عليها وسمكها.
- مستوى TP1، TP2، TP3 وإيقاف الخسارة هي نسب مئوية من الدخول، وتُعاد استخدام نفس الأرقام الأربعة للصفقات القصيرة.
- ثلاثة مرشحات اختيارية - بوابة اتجاه EMA 144، بوابة RSI وفجوة شريط دنيا بين الدخولات - متوفرة للمتداولين الذين يريدون إشارات أقل. وهي مغلقة بشكل افتراضي.
أين يعمل
أي رمز وأي إطار زمني. تم تصميمه حول M15، H1 و H4، وهو مناسب للعملات الرئيسية، الذهب والمؤشرات الرئيسية؛ كما يعمل على العملات الرقمية، حيث تميل المناطق لأن تكون أوسع بسبب ATR. الأطر الزمنية الأقل تعطي إشارات أكثر بكثير، وهذا ما تتحكم فيه المرشحات الاختيارية ومضاعف الإطار الزمني الأعلى.
التنبيهات
اثنا عشر حدثًا، لكل منها مفتاح تشغيل خاص: دخولات طويلة وقصيرة، الأهداف الثلاثة لكل اتجاه، والإيقافات. تذهب إلى سجل cTrader، وصوت اختياري، وبريد إلكتروني خاص بـ cTrader. التنبيهات تعمل فقط على الأشرطة المغلقة، ولا تعمل أبدًا على التاريخ الذي أغلق قبل إرفاق المؤشر، ولا مرتين لنفس الشريط.
المتطلبات والسلوك
cTrader 5.0 أو أحدث، سطح المكتب. لا يعلن المؤشر عن حقوق وصول: لا يفتح اتصال شبكة، لا يقرأ ملفات، ولا يضع أو يعدل أو يغلق أوامر. يتم تقييم الإشارة على شريط مغلق ولا تتحرك بعد ذلك. هناك أمران مؤقتان أثناء تشكيل الشريط الأحدث - المنطقة الأحدث، التي لم يتم تأكيد محورها بعد، وقيمة الإطار الزمني الأعلى، التي تُقرأ من الشريط الذي يحتوي على الشريط الحالي. يتوفر إعداد لقراءة الشريط المكتمل السابق للإطار الزمني الأعلى بدلاً من ذلك، والذي لا يعيد الرسم أبدًا.
هذا برنامج تحليلي ولا يعتبر أي مما يرسمه نصيحة. تسجل علامات الهدف والإيقاف فقط أن السعر لمس مستوى مرسوم على التاريخ المحمّل؛ لا يوجد فروق سعرية، عمولة أو انزلاق خلفها ولا تم وضع أي أمر.
التداول ينطوي على مخاطر. الأداء السابق لا يضمن النتائج المستقبلية.
الملخص
Key chart elements include supply and demand zones with points of interest, buy/sell markers, entry, stop loss, and three target levels displayed as stepped lines with shaded risk and reward bands. Optional swing labels (HH, LH, HL, LL) and a support/resistance layer with up to 21 levels are available. An eleven-row dashboard provides market context with trend, crossover state, RSI, ATR, and live trade details including stage, entry, stop, and targets.
Flintridge Trader Pro supports any symbol and timeframe, optimized for M15, H1, and H4 charts, and is suitable for forex majors, gold, major indices, and cryptocurrencies. It includes configurable settings for moving average type, swing length, zone width, and risk parameters. Alerts cover entries, targets, and stops, firing on closed bars only. The indicator is analytical software that does not place or manage orders.





























