

PnL Calendar Plus
إضافة سطح المكتب
الإصدار 1.0، Sep 2026
Windows, Mac

منذ 27/02/2026
33.16K
حجم التداول
25.96K
الربح بالبيب
10
المبيعات
533
التثبيتات المجانية
الوصف
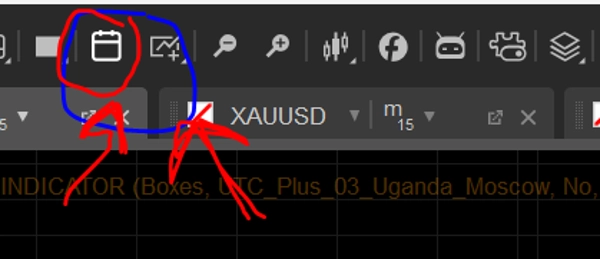
📅 عرض تقويم الأرباح والخسائر
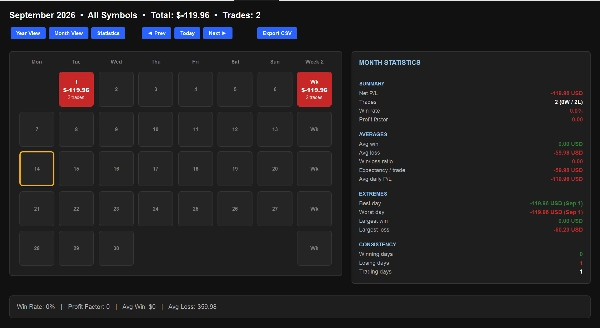
- خرائط الحرارة الشهرية والسنوية: شاهد المكاسب أو الخسائر اليومية والشهرية مع مربعات الأرباح (باللون الأخضر) والخسائر (باللون الأحمر) الملونة.
- الملخصات الأسبوعية: يتتبع إجمالي الأرباح والخسائر الأسبوعية وعدد الصفقات في نهاية كل صف.
📊 لوحة إحصائيات شاملة
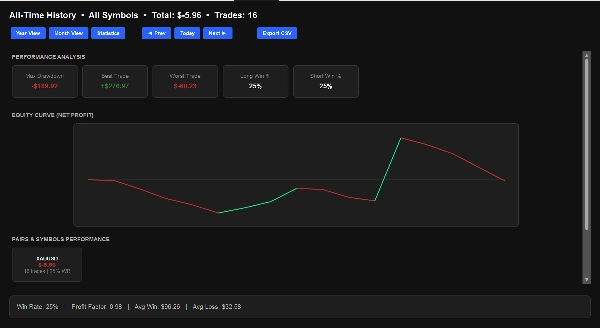
- مقاييس الأداء: عرض عامل الربح الإجمالي، معدل الفوز الكلي، متوسط مبالغ الربح/الخسارة، وأقصى انخفاض.
- مخطط منحنى الأسهم: رسم بياني بصري يتتبع تقدم صافي الربح الإجمالي مع مرور الوقت.
- تفصيل الرموز: شاهد الأداء، معدلات الفوز، وإجمالي الصفقات مقسمة حسب أزواج العملات أو الأدوات المحددة.
- تحليل الوقت: يحدد تلقائيًا أكثر أيام التداول ربحية والشهور الأعلى أداءً.
🔒 آمن وخفيف الوزن
- بدون أذونات خاصة: يعمل بحقوق وصول قياسية (
AccessRights.None)، مما يجعله آمنًا تمامًا وسهل التحميل على cTrader.
الملخص
ملخص الذكاء الاصطناعي
PnL Calendar Plus is a cTrader plugin designed to visualize and analyze trading performance through a calendar-based interface and detailed statistics. It features monthly and yearly heatmaps that display daily and monthly profits or losses using color-coded tiles (green for profit, red for loss). Weekly summaries provide total profit and loss (PnL) and trade counts for each week.
The plugin includes a comprehensive statistics dashboard offering key performance metrics such as total profit factor, overall win rate, average win and loss amounts, and maximum drawdown. An equity curve chart tracks net profit progression over time. Users can view a symbol breakdown showing performance, win rates, and trade counts by specific currency pairs or instruments. Time analysis automatically identifies the most profitable trading days and months.
PnL Calendar Plus operates with standard access rights, requiring no special permissions, ensuring safe and lightweight integration within the cTrader platform. It supports historical data analysis and is categorized under trade journaling and chart UI tools.
ملف تعريف الإضافة
فئة الإضافات
سجل العمليات
الوصول إلى البيانات
التاريخ
مناقشة
تقييمات العملاء
0.0
التقييمات: 0
تقييمات العملاء
لا توجد تقييمات لهذا المنتج حتى الآن. هل جرَّبته بالفعل؟ كن أول من يخبر الآخرين!
الأسئلة الشائعة
AI Integration
Chart UI Tools
Trade Journal
يتم توفير المنتجات المتاحة من خلال cTrader Store، بما في ذلك روبوتات التداول والمؤشرات والإضافات، من قبل مطوري الطرف الثالث وإتاحتها لأغراض الوصول المعلوماتي والفني فقط. cTrader Store ليس وسيطًا ولا يقدم نصائح استثمارية أو توصيات شخصية أو أي ضمان للأداء المستقبلي.
المزيد من هذا المؤلف












السعر
منذ 27/02/2026
33.16K
حجم التداول
25.96K
الربح بالبيب
10
المبيعات
533
التثبيتات المجانية