present
Zarejestruj się i otrzymaj 50 $ zniżki na pierwszy zakup
Od 09/06/2026
4
Sprzedaż

Opis

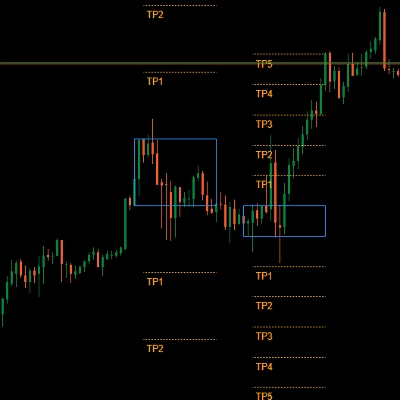
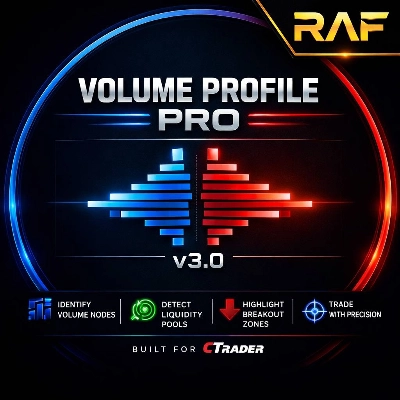
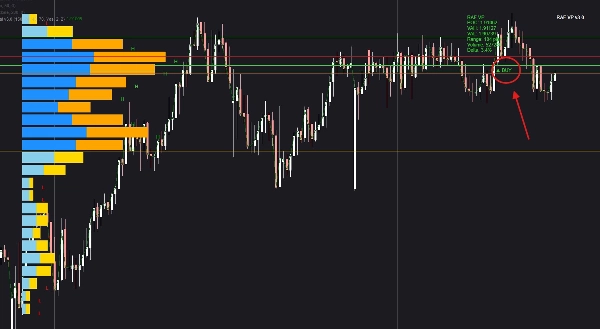
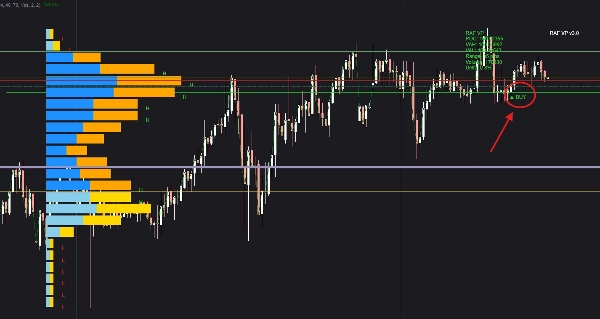
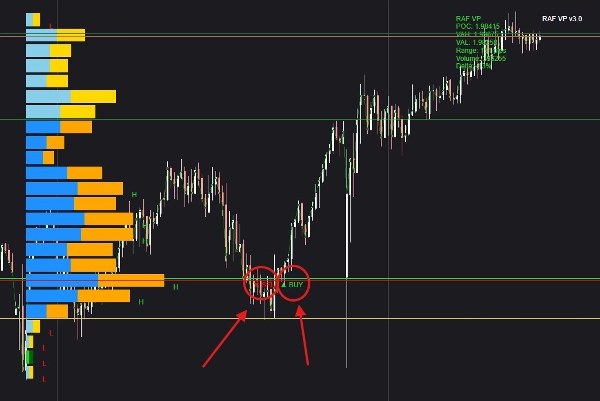
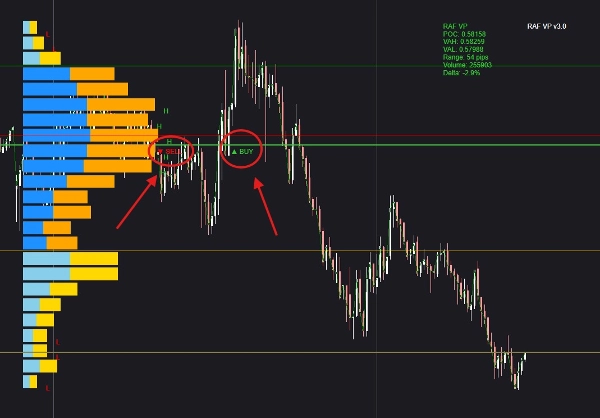
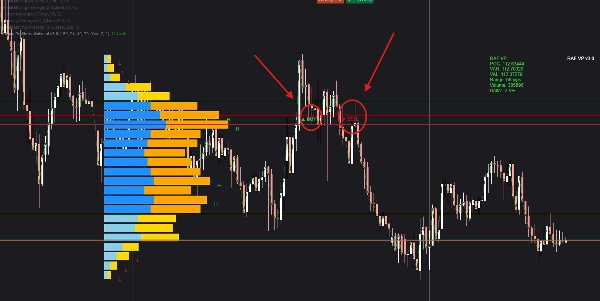
Analizuje każdą świecę, aby zmapować, gdzie skoncentrowany jest wolumen obrotu, ujawniając prawdziwe strefy aktywności traderów instytucjonalnych. Profil wolumenu na żywo pokazuje obszary HVN, gdzie cena prawdopodobnie się zatrzyma, oraz obszary LVN, gdzie może szybko przełamać poziom. Śledzenie delty ujawnia, czy kupujący czy sprzedający zyskują siłę w każdej świecy. Gdy cena wchodzi w interakcję z POC, strefami nierównowagi lub kluczowymi półkami wolumenu, system ocenia zachowanie przepływu zleceń i generuje sygnały KUPNA lub SPRZEDAŻY na podstawie zmian w kontroli rynku. Wbudowane okno informacyjne wyświetla na żywo POC, deltę, poziomy wolumenu oraz warunki sygnału, dzięki czemu traderzy mogą natychmiast zobaczyć, dlaczego formuje się setup i jak jest silny. Pomaga to zidentyfikować odwrócenia, kontynuacje oraz wejścia o wysokim prawdopodobieństwie z dużo większą dokładnością niż standardowe wskaźniki.

Podsumowanie

Podsumowanie AI
Raf Volume Profile Pro v3.0 is an advanced volume-profile indicator designed to analyze each candle's trading volume distribution, highlighting zones of institutional activity. It identifies High Volume Nodes (HVN) where price tends to stall and Low Volume Nodes (LVN) where price can move rapidly. The tool tracks delta within candles to determine whether buyers or sellers are gaining strength. When price interacts with the Point of Control (POC), imbalance zones, or key volume shelves, the indicator assesses order flow and generates buy or sell signals based on shifts in market control. A built-in info window displays live POC, delta, volume levels, and signal conditions, providing real-time insight into the strength and formation of setups. This functionality supports identifying reversals, continuation patterns, and high-probability trade entries with greater precision than standard indicators. The product integrates concepts such as exponential moving averages (EMA), breaker blocks, key levels, imbalances, and support/resistance within its volume-based analysis framework. It outputs actionable signals including level touches, breaks, reversals, breakouts, and trend strength, relying on volume data as its primary input.
Profil wskaźnika
Kategoria wskaźnika
Wolumen
Typ wyjścia
Sygnały
Wymagania dotyczące danych
Wolumen
Obsługiwane sygnały
Dotknięcie poziomu
Przebicie poziomu
Siła trendu
Przełamanie
Odwrócenie trendu

Dyskusja

Opinie klientów

5.0
Opinie: 2
5
100 %
4
0 %
3
0 %
2
0 %
1
0 %
Opinie klientów
October 8, 2026
Profiles inside individual candles make delta, POC interactions and volume nodes easier to examine alongside the ordinary price shape. That's a strong visual analysis format, with imbalance interpretation still dependent on the actual feed and calculation method.
October 4, 2026
Raf Volume Profile Pro v3.0 provides clear volume histograms, POC and Value Area levels, Delta statistics, and BUY/SELL markers. Tested on EURUSD H1 and XAUUSD H1/M1, the indicator displayed consistently with a useful statistics panel. The layout is generally readable, although the profile can occupy part of the chart. A practical addition for discretionary volume analysis.

Częste pytania

EMA
Breaker Block
Key Levels
Imbalance
Volume
Support & Resistance
Produkty dostępne za pośrednictwem cTrader Store, w tym boty handlowe, wskaźniki i wtyczki, dostarczane są przez deweloperów zewnętrznych i udostępniane wyłącznie w celach informacyjnych oraz w celu zapewnienia dostępu technicznego. cTrader Store nie jest brokerem i nie zapewnia doradztwa inwestycyjnego, nie udziela spersonalizowanych rekomendacji ani nie gwarantuje przyszłych wyników.

Cena

Od 09/06/2026
4
Sprzedaż