present
Zarejestruj się i otrzymaj 50 $ zniżki na pierwszy zakup
Trading product for LiquidityContextPro Wskaźnik Key Levels, image 1
LiquidityContextPro
Wskaźnik
82 pobrania
Wersja 1.0, Oct 2026
Windows, Mac
4.0
Opinie: 1
Trading product for LiquidityContextPro Wskaźnik Key Levels, image 2
Trading product for LiquidityContextPro Wskaźnik Key Levels, image 3
Trading product for LiquidityContextPro Wskaźnik Key Levels, image 4
Trading product for LiquidityContextPro Wskaźnik Key Levels, image 5
Od 09/03/2026
26.37M
Wolumen transakcji
46.37K
Zysk w pipsach
2
Sprzedaż
345
Bezpłatne instalacje

Opis

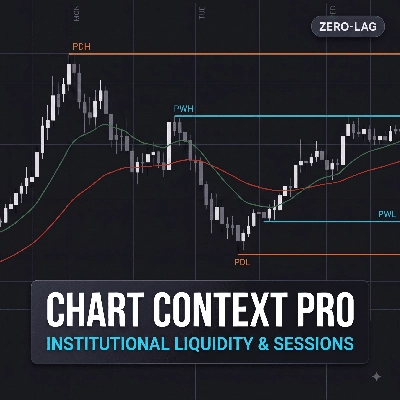
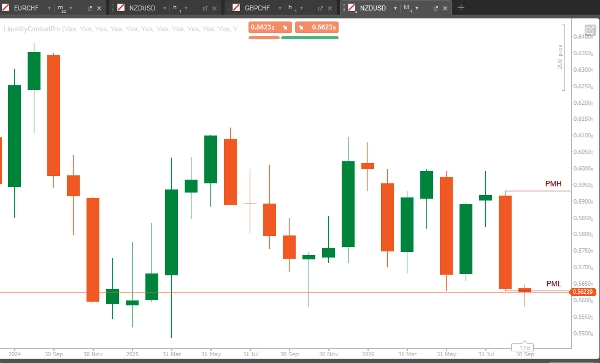
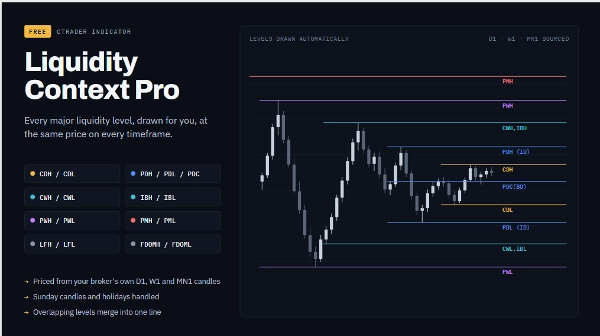
Przestań rysować te same poziomy na każdym nowym wykresie. Liquidity Context Pro rysuje wszystkie główne poziomy płynności natychmiast i aktualizuje je wraz z nadejściem każdego dnia, tygodnia i miesiąca.


POZIOMY

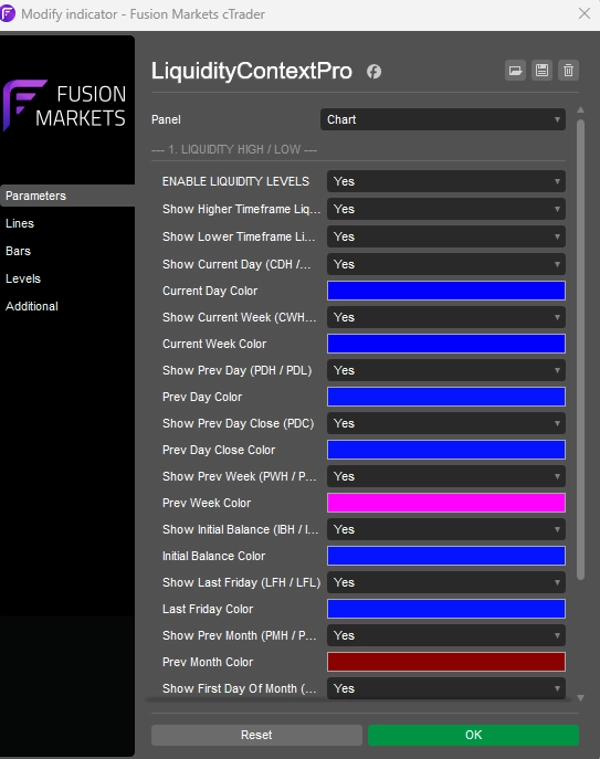
- CDH/CDL, CWH/CWL: bieżący dzień i tydzień, na żywo

- PDH/PDL (tag Inside Day), PDC (tag wybicia)

- PWH/PWL, PMH/PML: poprzedni tydzień i miesiąc

- IBH/IBL, LFH/LFL, FDOMH/FDOML


JAK TRADERZY ICH UŻYWAJĄ

- Przebicie i retest: cena zamyka się przez poziom, wraca i go utrzymuje. Trend często się kontynuuje.

- Zamiecenie i odrzucenie: cena handluje przez poziom, ale zamyka się z powrotem wewnątrz. Odwrócenie staje się bardziej prawdopodobne.


DLACZEGO TO JEST INNE

- Wyceniane na podstawie własnych świec D1, W1 i MN1 twojego brokera: ta sama cena na każdym interwale czasowym

- Obsługa świec niedzielnych i świąt

- Poziomy o tej samej cenie łączą się w jedną linię


ZASTRZEŻENIE

Tylko do analizy wykresów i edukacji, nie porada finansowa. Handel wiąże się z wysokim ryzykiem. Żaden poziom nie gwarantuje kontynuacji ani odwrócenia; używaj własnej analizy i zarządzania ryzykiem.

Podsumowanie

Podsumowanie AI
LiquidityContextPro is a trading indicator that automatically plots major liquidity levels on price charts, including current and previous day, week, and month highs and lows (e.g., PDH/PDL, PWH/PWL, PMH/PML), as well as other key levels like IBH/IBL and FDOMH/FDOML. These levels are derived from your broker’s daily, weekly, and monthly candles, ensuring consistent pricing across all timeframes. The indicator updates levels in real time as each day, week, and month progresses, eliminating the need to redraw them manually on new charts. It handles special cases such as Sunday candles and holidays, and merges overlapping levels into single lines for clarity. Traders use these levels to identify potential break and retest scenarios, where price closes beyond a level and then holds it, or sweep and reject patterns, where price briefly moves through a level but closes back inside, signaling possible reversals. The indicator is designed for chart analysis and educational purposes and does not provide financial advice.
Profil wskaźnika

Dyskusja

Opinie klientów

4.0
Opinie: 1
5
0 %
4
100 %
3
0 %
2
0 %
1
0 %
Opinie klientów
October 24, 2026
Consistent D1, W1 and MN1 reference prices across chart timeframes are the main appeal, with overlap merging and Sunday handling adding practical detail for reading sweeps and retests.

Częste pytania

Key Levels
Produkty dostępne za pośrednictwem cTrader Store, w tym boty handlowe, wskaźniki i wtyczki, dostarczane są przez deweloperów zewnętrznych i udostępniane wyłącznie w celach informacyjnych oraz w celu zapewnienia dostępu technicznego. cTrader Store nie jest brokerem i nie zapewnia doradztwa inwestycyjnego, nie udziela spersonalizowanych rekomendacji ani nie gwarantuje przyszłych wyników.

Więcej od tego autora

Wskaźnik
Fair Value Gap
Auto-draws every Fair Value Gap on any timeframe and removes it once filled. Clean, fast, free. Built for cTrader.
Wtyczka desktopowa
Trade Journal
Market Scanner
+2
Journal, stats, trade analysis, a daily coach and a daily bias for your real cTrader trades. Know why you lose; fix it.
Wskaźnik
BOS
CHOCH
+1
BoS & CHoCH on any timeframe. Body-close confirmed, no repaint, exact swing levels, H1–Monthly trend dashboard.
Wtyczka desktopowa
SL Manager
Risk/Reward
+5
Drag SL & TP on the chart, see risk, reward, R:R and lot size live, then place Buy or Sell orders in one click
Wskaźnik
Order Block
Order blocks confirmed by BOS, displacement and FVG, plus up to 3 higher-timeframe levels on one chart. No repaint
Wtyczka desktopowa
Prop Firm Fit
Trade Journal
+2
Paper trade your broker’s live prices in cTrader: demo accounts, prop challenges, a stats dashboard and trading journal
Wskaźnik
Key Levels
Support & Resistance
Day and week separators plus previous day high, low and close lines for every day on H1 and lower charts
Wtyczka desktopowa
Chart UI Tools
Replay your broker’s charts candle by candle. Rewind any time, switch timeframes and practise trades with full stats.
Wskaźnik
EMA
Outlines the first candle of the real session open for indices, forex & crypto. Auto DST, HTF candle panel & EMA.
Wskaźnik
BOS
CHOCH
+5
SMC structure indicator for cTrader: BOS/CHoCH, order blocks, FVGs, liquidity sweeps, key levels and alerts.
Wtyczka desktopowa
Balanced
Live M15, M30 and H1 candles inside your chart. Read 3-candle sweep-and-break setups across timeframes at a glance.
Wskaźnik
EMA
Flag
+2
Liquidity levels, trend lines, filtered chart patterns and a composite bias HUD in one cTrader overlay.

Możesz także polubić

Wskaźnik
ADX
ATR
+5
Configure, simulate, and analyze trading strategies with custom filters, multi-target exits, and detailed performance me
Wskaźnik
Forex
Crypto
+3
ICT Advanced Swings Indicator – Multi-Timeframe Precision
Wskaźnik
Forex
GBPUSD
+3
Support & resistance zones with measured hold rates and confidence intervals — evidence, not just lines on a chart.
Wskaźnik
ATR
RSI
+6
💹 Define a price channel 📈 and determine trend direction (bullish 🟢 or bearish 🔴).
Wskaźnik
Crypto
GBPUSD
+7
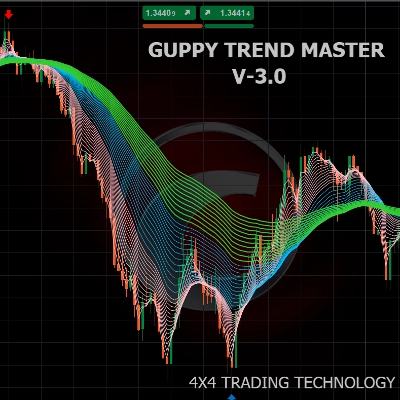
GUPPY TREND MASTER V3.. Visualize Market Sentiment with the 38-EMA Rainbow The Guppy Trend Master 4X4 Indicator
Wskaźnik
Doji
Wedge
+5
Angora Pattern Recognition is a cTrader indicator that finds, draws and tracks classic chart patterns automatically.
Wskaźnik
ADX
ATR
+5
Identifies TRENDING, RANGING and VOLATILE markets with pullback detection. Anti-noise filter. Works on ANY chart.
Logo „ATR Bands”
Popularne
4.7
(4)
od $9
Wskaźnik
ATR
Prop
+13
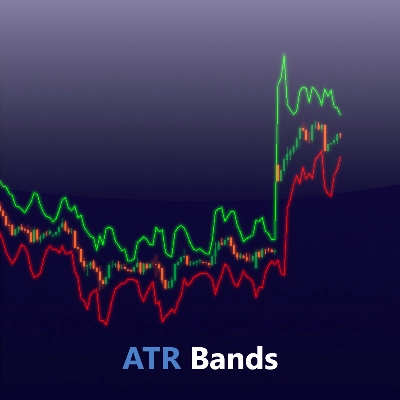
Enhance trading with ATR Bands! Visualize market volatility using dynamic upper and lower ATR bands for precise decision
Wskaźnik
RSI
Forex
+10
Unlock Stochastic RSI PRO in cTrader! Overlay RSI, highlight zones, and identify divergences with customizable settings.
Wskaźnik
Forex
Crypto
+6
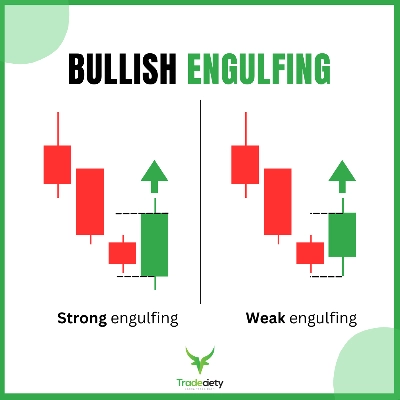
Smart Price Action Scanner 🔍 Detects engulfing, pin bars & inside bars with trend filter for cleaner entries ✅
Wskaźnik
Fibonacci
Key Levels
+1
Explore Elliott wave counts, three swing sizes and example levels with an interactive cTrader chart panel.
Wskaźnik
Key Levels
Support & Resistance
Add your provider's gamma levels by hand or automatically with our feed plugin, and see the gamma regime at a glance.
Logo „MM-Symbol Info (Pro)”
Najwyżej oceniane
4.5
(4)
$19
Wskaźnik
Prop
Forex
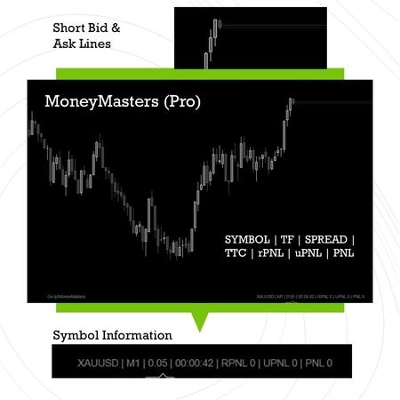
NEW - PNLs as % - daily, weekly, monthly, or yearly & Spread, Time To Close, PNL Alerts, custom Bid / Ask lines
Logo „Vwap Bands”
Najwyżej oceniane
4.5
(4)
$19
/
$29
Wskaźnik
VWAP
Moving Average
Vwap Bands it is highly sought after by professional traders because it includes Standard Deviation Bands
Wskaźnik
ATR
Forex
+6
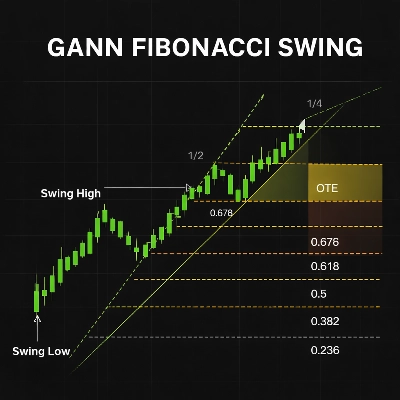
It combines swing (pivot-based) market structure detection with Gann Fan geometry and Fibonacci retracement/extension
Wskaźnik
This is the trial version of Time To Break Even, which help you time your trade entry.
Wskaźnik
Three ZigZag lines
Wskaźnik
RSI
Indicator Stochastic With RSI

Cena

Od 09/03/2026
26.37M
Wolumen transakcji
46.37K
Zysk w pipsach
2
Sprzedaż
345
Bezpłatne instalacje