
Indicador Avançado de Zonas Donchian para cTrader
Domine as Tendências do Mercado e Rompimentos com Precisão!
Leve seu trading para o próximo nível com o Indicador Avançado de Zonas Donchian – uma ferramenta poderosa projetada para traders que exigem precisão, flexibilidade e eficiência. Este indicador de próxima geração aprimora os Canais Donchian clássicos ao introduzir análise em múltiplos períodos, cálculos de preço personalizáveis, alertas em tempo real e visualização em nuvem.
Quer você negocie forex, ações ou commodities, o Indicador Avançado de Zonas Donchian oferece as ferramentas para identificar rompimentos, seguir tendências e negociar reversões como um profissional.
Principais Recursos e Benefícios:
1. Zonas Donchian em Múltiplos Períodos
- Analise as Zonas Donchian de um período maior enquanto negocia em um menor, garantindo que você sempre esteja alinhado com a tendência maior do mercado.
- Ideal para day traders e swing traders que buscam otimizar suas entradas e saídas.
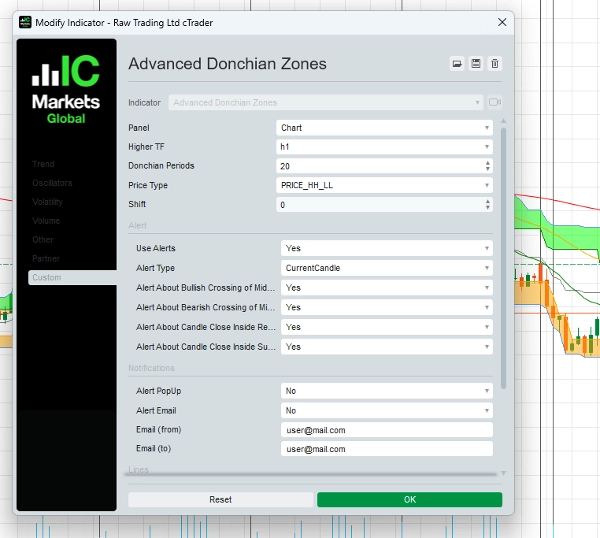
2. Cálculo de Preço Personalizável
- Escolha entre cinco tipos avançados de preço para refinar sua estratégia:
-
- Maior Máxima / Menor Mínima
- Média de Máxima/Abertura ou Máxima/Fechamento
- Maior Abertura / Menor Abertura
- Maior Fechamento / Menor Fechamento
- Adapte o indicador para adequar seu estilo de trading e gestão de risco.
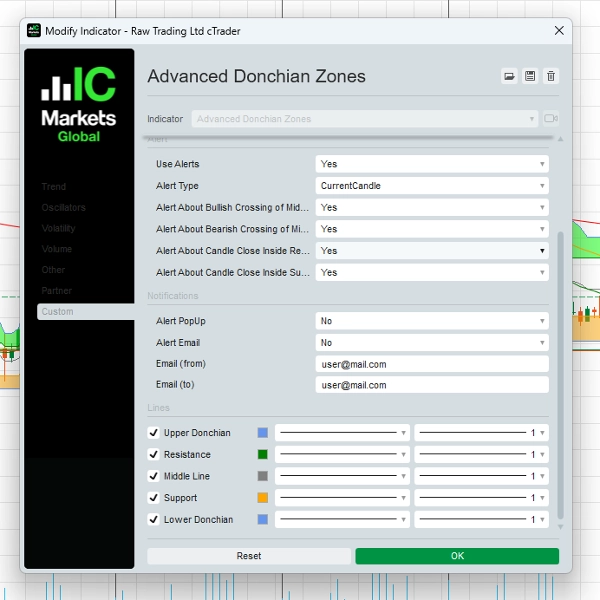
3. Alertas Dinâmicos – Nunca Perca uma Oportunidade!
- Receba notificações em tempo real quando eventos-chave de trading ocorrerem:
-
- Cruzamentos da Linha Média (sinais de alta ou baixa)
- Fechamento do Preço Dentro das Zonas-Chave (zonas potenciais de reversão ou rompimento)
- Alertas disponíveis via pop-ups e email, mantendo você à frente dos movimentos do mercado.
4. Visualização em Nuvem para Insights Claros
- Zonas sombreadas únicas entre os níveis Donchian ajudam os traders a identificar visualmente áreas de suporte, resistência e rompimento de forma rápida e eficaz.
5. Parâmetro de Deslocamento Flexível
- Ajuste o posicionamento das Zonas Donchian para frente ou para trás no tempo para afinar sua estratégia de trading.
6. Interface Fácil de Usar
- Projetado para traders de todos os níveis, com um layout intuitivo e configurações personalizáveis para combinar com suas preferências de trading.
Como Usar o Indicador Avançado de Zonas Donchian
1. Estratégia de Trading de Rompimento – Capture Movimentos Explosivos!
- Configuração:
-
- Aplique o Indicador Avançado de Zonas Donchian ao seu gráfico.
- Selecione um período Donchian (ex.: 20) e um período maior (ex.: 1H ou 4H) para sinais mais precisos.
- Entrada:
-
- Comprar quando o preço romper e fechar acima da zona Donchian superior.
- Vender quando o preço romper e fechar abaixo da zona Donchian inferior.
- Saída:
-
- Use a linha média ou a zona Donchian oposta como seu nível de saída.
- Exemplo:
-
- Se estiver negociando um gráfico de 15 minutos, defina o cálculo Donchian baseado em um período de 1 hora. Quando o preço romper acima do nível Donchian superior, entre em uma operação de compra com stop-loss próximo à linha média.
2. Estratégia de Seguimento de Tendência – Aproveite o Momentum do Mercado
- Configuração:
-
- Use a linha média como filtro de tendência.
- Negocie apenas na direção da tendência predominante.
- Entrada:
-
- Comprar quando o preço estiver acima da linha média e rebater na zona de suporte.
- Vender quando o preço estiver abaixo da linha média e rebater na zona de resistência.
- Saída:
-
- Feche a operação quando o preço cruzar a linha média na direção oposta.
- Exemplo:
-
- Em um gráfico de 4 horas, o preço permanece acima da linha média, confirmando uma tendência de alta. Entre em uma operação de compra quando o preço retrair para a zona de suporte e mostrar sinais de reversão.
3. Estratégia de Trading em Faixa – Lucre em Mercados Laterais
- Configuração:
-
- Identifique períodos em que o preço oscila entre as zonas Donchian superior e inferior.
- Entrada:
-
- Comprar quando o preço se aproximar do suporte.
- Vender quando o preço se aproximar da resistência.
- Saída:
-
- Realize lucros próximo à zona Donchian oposta ou quando ocorrer um rompimento.
- Exemplo:
-
- Em um gráfico de 1 hora, se o preço estiver oscilando entre os níveis Donchian superior e inferior, execute operações nesses extremos para oportunidades de reversão à média.
Por Que os Traders Escolhem as Zonas Donchian Avançadas
✔ Versátil para Diferentes Estilos de Trading – Funciona para rompimentos, seguimento de tendência e trading em faixa.
✔ Aprimora a Precisão do Trading – Identifique níveis-chave de suporte e resistência com precisão.
✔ Alertas em Tempo Real – Mantenha-se informado com notificações instantâneas.
✔ Ferramenta de Nível Profissional – Desenvolvida para traders que buscam uma vantagem no mercado.
Preço e Oferta Exclusiva
Preço Especial por Tempo Limitado: $97 (Pagamento Único)
Inclui:
- Indicador Avançado de Zonas Donchian para cTrader
- Guia Completo do Usuário com estratégias passo a passo
- Atualizações Gratuitas por 1 Ano
- Suporte Prioritário por Email
O Que os Traders Estão Dizendo
“Eu uso os Canais Donchian há anos, mas este indicador eleva a experiência a outro nível. O recurso de múltiplos períodos é revolucionário!”
— Mark S., Trader de Forex
“Os alertas e as configurações de preço personalizáveis me ajudam a capturar operações de rompimento com mais confiança. Altamente recomendado para traders sérios.”
— Lisa T., Swing Trader
Comece Hoje Mesmo!
Pronto para transformar seu trading? Clique no botão abaixo para comprar o Indicador Avançado de Zonas Donchian e comece a negociar com precisão!
[Compre Agora por $97]
Garantia de Devolução do Dinheiro em 30 Dias
Nós confiamos em nosso produto. Se você não estiver completamente satisfeito, entre em contato conosco dentro de 30 dias para um reembolso total – sem perguntas.
Precisa de Ajuda? Contate-Nos!
📧 Email: o.elmottaqy@gmail.com
🌐 Website: https://t.me/mottaqyo
Aviso de Risco
Negociar envolve riscos. O Indicador Avançado de Zonas Donchian é uma ferramenta para auxiliar suas decisões de trading, mas não garante lucros. Sempre use uma gestão de risco adequada e negocie com responsabilidade.
5 | 50 % | |
4 | 50 % | |
3 | 0 % | |
2 | 0 % | |
1 | 0 % |


