present
가입하고 첫 구매 시 $50 할인을 받으세요
Trading product for DayContextPro 지표 Key Levels Support & Resistance, image 1
DayContextPro
지표
1 다운로드
버전 1.1, Oct 2026
Windows, Mac
Trading product for DayContextPro 지표 Key Levels Support & Resistance, image 2
Trading product for DayContextPro 지표 Key Levels Support & Resistance, image 3
가입일 09/03/2026
48
무료 설치

설명

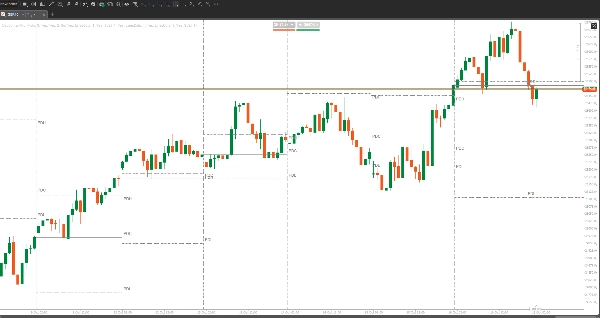
DayContextPro gives intraday charts a clean daily structure. It marks where each trading day and week begins, and carries the previous day’s high, low and close into the next day. These lines are drawn for every day in the chart’s history, not just today, so you can scroll back and see how price reacted to these levels day after day.

Indicator type: Price action and support/resistance (chart overlay)
Preferred instruments: FX pairs, gold, indices and any symbol with a daily session
Preferred periods: M1 to H1. The indicator draws nothing on H2 and above.
Platform: cTrader Windows and Mac (desktop only)

Trading use cases

  • Seeing where each day and week starts at a glance
  • Watching how price reacts at the previous day’s high, low and close
  • Reviewing past days to study breakouts, sweeps and rejections at these levels
  • Planning targets and stops around the previous day’s range

What it draws

  • Day separator: a lines-dots vertical line at the start of each trading day
  • Week separator: a solid vertical line at each week boundary
  • Previous day high and low (PDH/PDL): lines-dots lines across the following day
  • Previous day close (PDC): a solid line across the following day

Each day’s levels span that day only, so past days stay easy to read. Today’s levels run to the right edge of the chart. PDH, PDL and PDC labels show for today, with an option to label past days too.

Accurate trading days
Days follow your broker’s own daily candles, so the lines match its D1 chart. On brokers with a short Sunday candle, that candle counts as part of Monday, so Friday’s levels carry into Monday as they should.

Colors that fit your chart
In Auto mode, lines are grey on a light chart and white on a dark chart. They update straight away if you switch theme. In Custom mode, every line type has its own color.

Settings

  • Show or hide each line type
  • Colour, line style and thickness for each line type
  • Number of past days to draw (all by default)
  • Label options

Notes

  • The indicator does not place trades or predict price.
  • Previous day levels are reference points, not signals. Always use proper risk management.

Trading involves risk. Past performance does not guarantee future results.

요약

AI summary
DayContextPro is a chart overlay indicator designed for cTrader desktop (Windows and Mac) that enhances intraday price action analysis on M1 to H1 timeframes. It visually structures intraday charts by marking the start of each trading day and week with vertical separator lines. The indicator also plots the previous day’s high, low, and close levels as horizontal lines extending across the following day, allowing traders to observe how price interacts with these key reference points over time.

Key features include:
- Day separators (lines-dots vertical lines) and week separators (solid vertical lines).
- Previous day high and low (PDH/PDL) shown as lines-dots lines.
- Previous day close (PDC) shown as a solid horizontal line.
- Levels are drawn for every day in the chart history, not just the current day.
- Labels for today’s PDH, PDL, and PDC with optional labels for past days.
- Automatic color adaptation to chart theme or customizable colors and line styles.
- Settings to show/hide line types, adjust colors, line thickness, and number of past days displayed.

The indicator uses the broker’s daily candle definitions to ensure accurate daily boundaries. It supports FX pairs, gold, indices, and any symbol with a daily session. DayContextPro does not generate trade signals or place trades; it provides visual reference levels to assist with planning targets, stops, and studying price behavior around previous day ranges.

지표 프로필

고객 리뷰

0.0
리뷰: 0
고객 리뷰
이 상품에 대한 리뷰가 아직 없습니다. 이미 사용해 보셨나요? 다른 사람들에게 가장 먼저 소개해 주세요!

상담

자주 묻는 질문(FAQ)

Key Levels
Support & Resistance
트레이딩 봇, 지표, 플러그인 등 cTrader Store에서 제공되는 상품은 제3자 개발자에 의해 제공되며, 이는 단순히 정보 및 기술적 접근을 목적으로 제공된 것입니다. cTrader Store는 중개인이 아니며, 투자 조언, 개인별 추천 또는 향후 성과에 대한 어떠한 보장도 제공하지 않습니다.

이 작성자의 상품 더 보기

지표
Key Levels
Every major liquidity level drawn for you: PDH/PDL, PWH/PWL, PMH/PML and more. Same price on every timeframe. Free.
데스크톱 플러그인
Prop Firm Fit
Trade Journal
+1
Paper trade your broker’s live prices in cTrader: demo accounts, prop challenges, a stats dashboard and trading journal
지표
Fair Value Gap
Auto-draws every Fair Value Gap on any timeframe and removes it once filled. Clean, fast, free. Built for cTrader.
데스크톱 플러그인
Trade Journal
Trade Statistics
Track. Analyze. Improve. A journal and statistics for your real cTrader trades, with a prop challenge guard.
지표
EMA
Outlines the first candle of the real session open for indices, forex & crypto. Auto DST, HTF candle panel & EMA.
지표
EMA
Flag
+2
Liquidity levels, trend lines, filtered chart patterns and a composite bias HUD in one cTrader overlay.
데스크톱 플러그인
SL Manager
Risk/Reward
+5
Drag SL & TP on the chart, see risk, reward, R:R and lot size live, then place Buy or Sell orders in one click
지표
BOS
CHOCH
+5
SMC structure indicator for cTrader: BOS/CHoCH, order blocks, FVGs, liquidity sweeps, key levels and alerts.
데스크톱 플러그인
Chart UI Tools
Replay your broker’s charts candle by candle. Rewind any time, switch timeframes and practise trades with full stats.

좋아하실 만한 다른 항목

지표
ATR
MSS
+5
Advanced market structure and institutional cycle mapper with visual reference cards and entry alerts
지표
Prop
Crypto
+5
VIX Pro: Confirm Real Breakouts & Filter Market Noise with Volatility
지표
ATR
RSI
+1
Super Trend Rsi ,ATR + trend change distance + dynamic Alpha, divergence/convergence
지표
AI
ATR
+26
Liquidity Cluster Order automatically detects and draws accumulation zones & distribution zones
지표
AI
ATR
+19
Market Cipher A
지표
AI
ATR
+26
SR Commander — Multi Timeframe Edition. See where the big money draws the line. Trade on your timeframe. Think on theirs
지표
AI
ATR
+26
MacD Custom Indicator-Multiple Time Frame
지표
Prop
Forex
+5
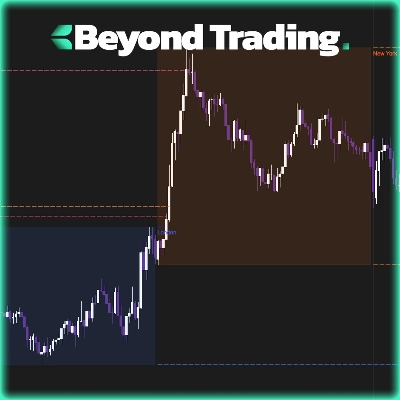
Tracks NY, London, Tokyo, Sydney sessions with custom visuals, and a real-time expanding range box and breakout High/Low
지표
AI
SMC
+18
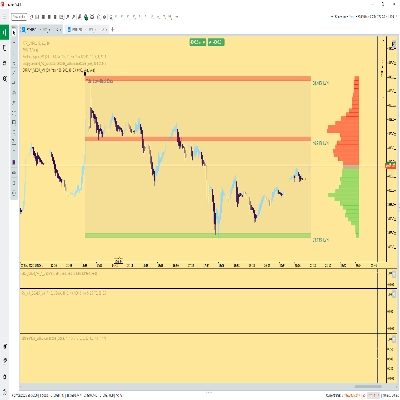
Volume Profile Supply Demand
지표
Volume
Custom range volume profile between two draggable anchors. Auto source timeframe, Total/Up-Down/Delta, POC, Value Area.
지표
Forex
Signal
+2
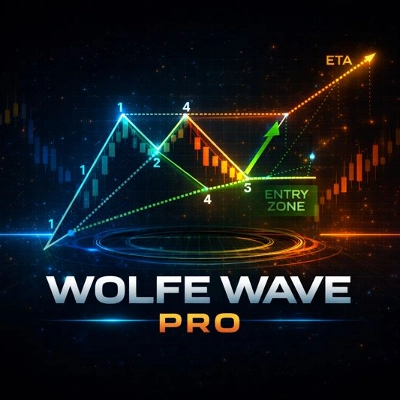
Automatic Wolfe Wave detection with full trade projection and performance dashboard for traders.
"ZigZag" 로고
최고 평점
4.3
(6)
무료
지표
ATR
RSI
+7
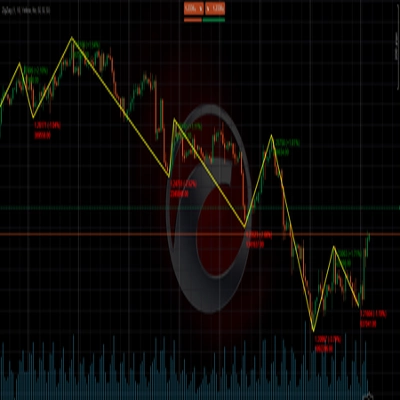
ZigZag filters noise, spots trends, patterns, pivots, aiding analysis, trade management, and confirmations. 📉📈
지표
Prop
Forex
+11
A visual indicator designed to help traders identify and track market activity across different trading sessions.
지표
SMC
Forex
+5
Pinpoint FVGs, track fills and see mitigation stats — trade imbalances with clarity and confidence.
지표
ATR
Wedge
+2
Strong Supertrend Turn Market Movement into a Clear Map Market analysis
지표
BOS
Volume
+5
The Volume Delta Indicator using Institutional Level 2 DOM Data, The Edge Institutions Pay Millions For, now on cTrader
지표
BOS
CHOCH
+5
BOS/CHoCH signals confirmed by liquidity sweep + FVG confluence, with a live conviction score.
지표
ATR
RSI
+7
Track the Movement of Market Assets with an Oscillator Scanner in Real-Time!

가격

가입일 09/03/2026
48
무료 설치