VIX - volatility indicator - Renko
Indicador
Versión 1.0, Feb 2025
Windows, Mac
Descripción
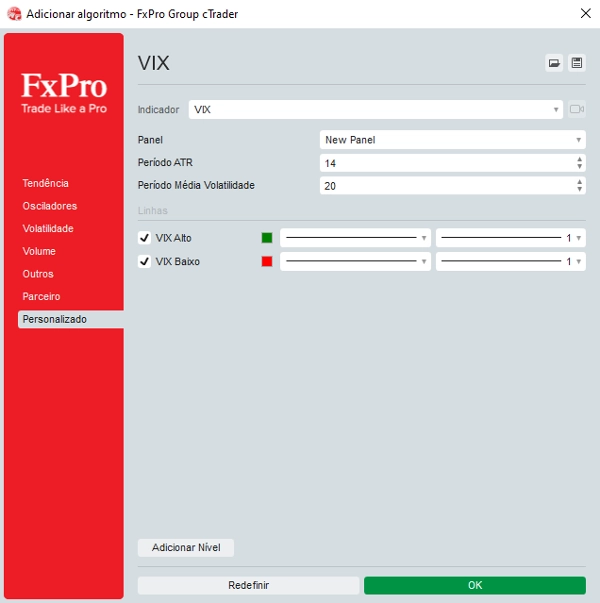
Ajusta los parámetros: Ingresa los valores deseados para los niveles LowLevel y HighLevel, y ajusta el Factor de Escala VIX para que la línea VIX tenga la altura deseada.
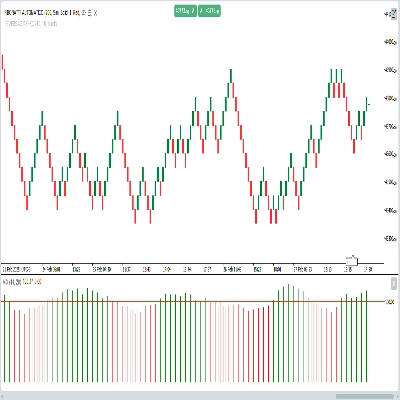
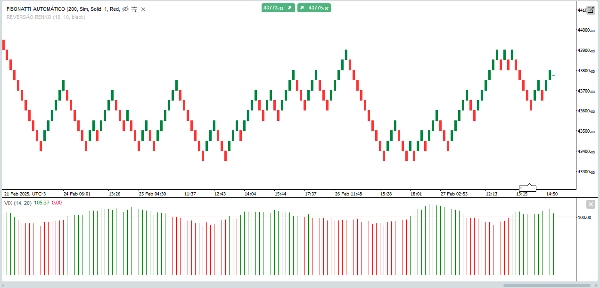
Observa el gráfico:
Cuando el VIX supera el HighLevel y el volumen es alto (velas verdes), puedes considerar que hay una ruptura.
Cuando el VIX está por debajo del LowLevel, puede indicar un período de baja volatilidad.
Resumen
Perfil del indicador
Valoraciones de clientes
0.0
Valoraciones: 0
Valoraciones de clientes
Este producto todavía no se ha valorado. ¿Ya lo ha probado? Sea el primero en informar a otros.
Conversación
Preguntas frecuentes
Breakout
Los productos disponibles a través de cTrader Store, incluidos bots, indicadores y plugins para operar, son proporcionados por desarrolladores de terceros y están disponibles únicamente con fines informativos y de acceso técnico. cTrader Store no es un bróker, por lo que no proporciona asesoramiento de inversión, recomendaciones personales ni ninguna garantía de rentabilidad futura.


Precio
Desde 05/02/2025
30
Ventas