Descripción
Indicador de Agrupamiento
Resumen
El Indicador de Agrupamiento es una herramienta poderosa diseñada para ayudar a los traders a identificar patrones, tendencias y anomalías en los datos del mercado. Al agrupar puntos de datos similares en clústeres, este indicador proporciona información valiosa que puede usarse para tomar decisiones de trading informadas.
Características
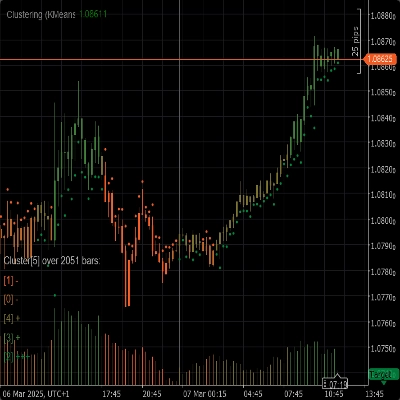
- Algoritmos de Agrupamiento: Utiliza algoritmos avanzados de agrupamiento como K-Means y Modelo de Mezcla Gaussiana (GMM) para segmentar eficazmente los datos del mercado.
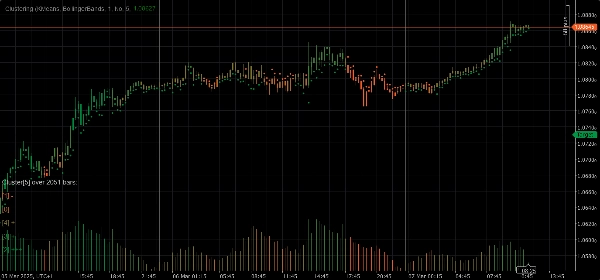
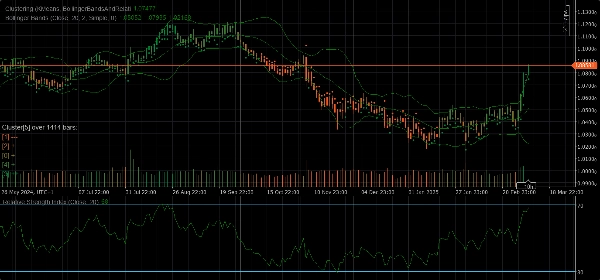
- Conjuntos de Características: Ofrece una variedad de conjuntos de características que incluyen Precio Bruto, Bandas de Bollinger, Índice de Fuerza Relativa (RSI), Oscilador Estocástico, Bandas de Bollinger y RSI, y combinaciones de estos indicadores para capturar diferentes aspectos del comportamiento del mercado.
- Agrupamiento Dinámico: Determina automáticamente el número óptimo de clústeres asegurando que el agrupamiento sea lo más preciso posible.
- Visualización: Proporciona una visión clara de los movimientos y la volatilidad de los clústeres directamente en su gráfico.
Parámetros
- Algoritmo de Agrupamiento: Elija entre K-Means o Modelo de Mezcla Gaussiana (GMM) para adaptarse mejor a su estrategia de trading.
- Conjunto de Características: Seleccione entre Precio Bruto, Bandas de Bollinger, RSI, Oscilador Estocástico, Bandas de Bollinger y RSI, o un conjunto completo de datos de mercado que incluye varios indicadores.
- Ventana: Defina el número de barras a considerar para cada punto de datos.
- Auto K: Determine automáticamente el número de clústeres basado en sus datos.
- K Inicial: Establezca un número inicial de clústeres si Auto K está deshabilitado.
- Máximo de Barras Históricas: Limite el número máximo de barras históricas usadas para el agrupamiento. Si se establece en 0, se usan todas las barras disponibles.
- Color por Clústeres: Habilite o deshabilite el recoloreado del gráfico basado en las asignaciones reales de clústeres.
- Mostrar Información: Muestre información detallada sobre cada clúster directamente en el gráfico.
- Mostrar Indicadores: Muestre los indicadores usados en los conjuntos de características.
Parámetros de Adaptación Automática
- Adaptación Automática: Habilite o deshabilite el modo de adaptación automática, que permite al indicador reinicializar los clústeres basándose en condiciones especificadas.
- Hora de Adaptación Automática: La hora del día en que puede ocurrir la adaptación automática (0-23).
- Periodo de Adaptación Automática: El número mínimo de horas que deben pasar desde la última adaptación antes de que pueda ocurrir otra.
Parámetros del Conjunto de Características
Parámetros de Bandas de Bollinger
- Periodo: El periodo para calcular las Bandas de Bollinger.
- Desviación: El multiplicador de desviación estándar para las Bandas de Bollinger.
- Tipo de Media Móvil: El tipo de media móvil usada en el cálculo de las Bandas de Bollinger (Simple, Exponencial, etc.).
Parámetros del Índice de Fuerza Relativa (RSI)
- Periodo: El periodo para calcular el RSI.
Parámetros del Oscilador Estocástico
- Periodo: El periodo K para el Oscilador Estocástico.
- Desaceleración K: El factor de desaceleración K para el Oscilador Estocástico.
- Periodo D: El periodo D para el Oscilador Estocástico.
- Tipo de Media Móvil: El tipo de media móvil usada en el cálculo del Oscilador Estocástico (Simple, Exponencial, etc.).
- Tipo de Cálculo: El tipo de cálculo para el Oscilador Estocástico (LowHigh, CloseClose, etc.).
Uso
1. Añada el Indicador de Agrupamiento a su gráfico.
2. Configure los parámetros según su estrategia de trading.
3. Analice los clústeres y sus movimientos en el gráfico.
4. Use la información proporcionada por el indicador para tomar decisiones de trading informadas.
Resumen
Valoraciones de clientes
5 | 50 % | |
4 | 50 % | |
3 | 0 % | |
2 | 0 % | |
1 | 0 % |


