
Rsi + Volume
مؤشر
707 التنزيلات
الإصدار 1.0، Mar 2025
Windows, Mac
5.0
التقييمات: 3
الوصف
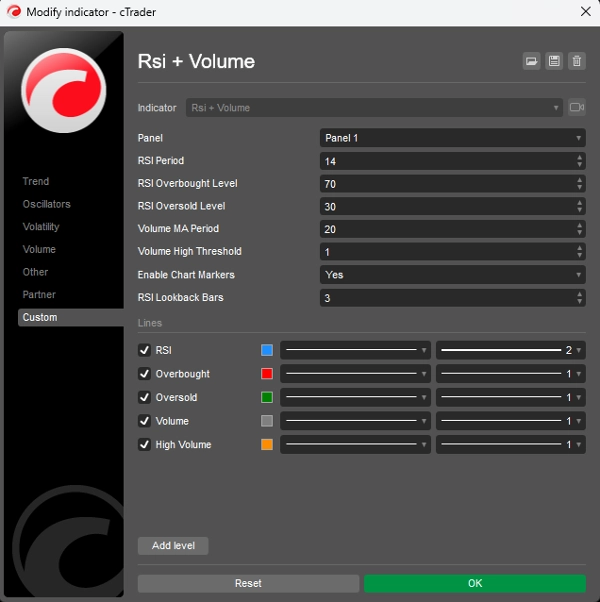
يجمع هذا المؤشر بين مؤشر القوة النسبية (RSI) وتحليل الحجم لتوليد إشارات تداول أكثر موثوقية. يعمل على مبدأ أن التحركات السعرية الكبيرة يجب أن تكون مصحوبة بحجم تداول مرتفع لتأكيد قوة الحركة.
المكونات الرئيسية:
- تحليل RSI:
-
- يقيس سرعة وتغير تحركات السعر على مقياس من 0 إلى 100
- يحدد حالات الشراء المفرط (فوق 70) وحالات البيع المفرط (تحت 30)
- يساعد في اكتشاف نقاط الانعكاس المحتملة في السوق
- تحليل الحجم:
-
- يقارن الحجم الحالي بمتوسط متحرك للحجم الأخير
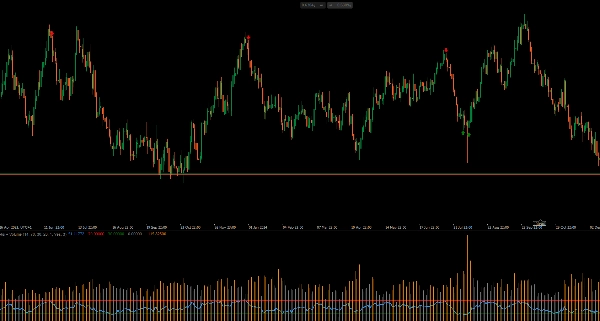
- يسلط الضوء على فترات الحجم العالي (أشرطة المدرج التكراري البرتقالية)
- يؤكد القوة وراء تحركات السعر
- توليد الإشارات:
-
- إشارة شراء: عندما يتجاوز RSI مستوى البيع المفرط (30) مع حجم تداول مرتفع
- إشارة بيع: عندما ينخفض RSI تحت مستوى الشراء المفرط (70) مع حجم تداول مرتفع
- تظهر الإشارات المرئية مباشرة على الرسم البياني (سهام خضراء للأعلى للشراء، سهام حمراء للأسفل للبيع)
كيفية استخدامه:
- ابحث عن إشارات الشراء عندما يكون السعر في اتجاه هابط ويظهر RSI حالات بيع مفرط
- ابحث عن إشارات البيع عندما يكون السعر في اتجاه صاعد ويظهر RSI حالات شراء مفرط
- يؤكد الحجم الأعلى قوة الإشارة
- قم بضبط المعلمات (فترة RSI، عتبة الحجم) لتتناسب مع إطار التداول الخاص بك
يساعد هذا المؤشر في تصفية الإشارات الخاطئة من خلال اشتراط تأكيد RSI وحجم تداول فوق المتوسط، مما يجعله أكثر موثوقية من استخدام RSI بمفرده.
الملخص
ملخص الذكاء الاصطناعي
The "Rsi + Volume" indicator integrates the Relative Strength Index (RSI) with volume analysis to enhance the reliability of trading signals. It operates on the principle that significant price movements should be confirmed by high trading volume.
Key components include:
1. RSI Analysis:
- Measures the speed and change of price movements on a 0-100 scale.
- Identifies overbought conditions (above 70) and oversold conditions (below 30).
- Helps detect potential market reversal points.
2. Volume Analysis:
- Compares current volume against a moving average of recent volume.
- Highlights periods of high volume using orange histogram bars.
- Confirms the strength behind price movements.
Signal generation occurs when RSI crosses key thresholds with accompanying high volume:
- Buy signals trigger when RSI rises above the oversold level (30) with high volume.
- Sell signals trigger when RSI falls below the overbought level (70) with high volume.
Visual signals appear directly on the chart as green up arrows for buys and red down arrows for sells.
Users can adjust parameters such as RSI period and volume threshold to fit their trading timeframe. This indicator aims to filter out false signals by requiring both RSI confirmation and above-average volume, providing more dependable trade signals than RSI alone.
ملف تعريف المؤشر
تقييمات العملاء
5.0
التقييمات: 3
5 | 100 % | |
4 | 0 % | |
3 | 0 % | |
2 | 0 % | |
1 | 0 % |
تقييمات العملاء
October 12, 2025
Hello, the RSI +volume indicator is perfect, but it needed to have something: when the little arrow appears on the chart, it could show a notification or an alarm. Would you be able to add that alarm or notification in cTrader?
August 12, 2025
Pros: Combines RSI and volume for stronger trading signals. Works well when RSI threshold intersects with high volume spikes. Lightweight and clear visuals. Cons: No alerts or tooltips. Lacks template saving. May generate noise on low-volume timeframes without additional filters.
مناقشة
الأسئلة الشائعة
Signal
Indices
RSI
يتم توفير المنتجات المتاحة من خلال cTrader Store، بما في ذلك روبوتات التداول والمؤشرات والإضافات، من قبل مطوري الطرف الثالث وإتاحتها لأغراض الوصول المعلوماتي والفني فقط. cTrader Store ليس وسيطًا ولا يقدم نصائح استثمارية أو توصيات شخصية أو أي ضمان للأداء المستقبلي.


السعر
منذ 21/02/2025
466.3M
حجم التداول
180.83K
الربح بالبيب
22
المبيعات
6.92K
التثبيتات المجانية