
MultiMAIndicator_Optimized
Indikator
1 käufe
Version 1.0, Jun 2025
Windows, Mac
4.0
Bewertungen: 4
Seit 03/04/2025
1.71B
Gehandeltes Volumen
556.96K
Pip-Gewinn
1
Verkäufe
Beschreibung
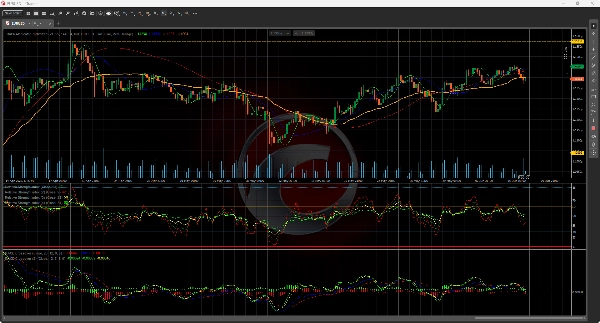
Multi-Indikator-Konfiguration
Hauptdiagramm
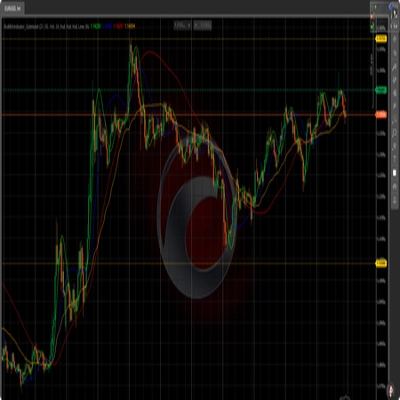
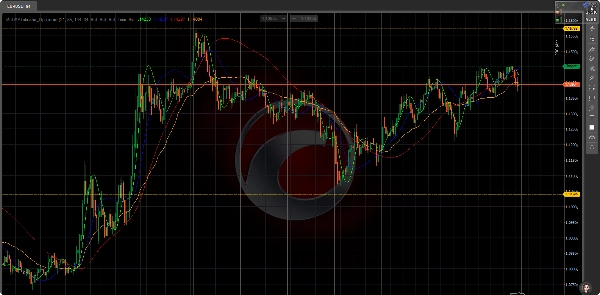
Zeigt 3 Hull Moving Averages (HMA) und 1 Volume Weighted Moving Average (VWMA)
Erstes Unterdiagramm
Zeigt den RSI-Indikator mit überkauften/überverkauften Niveaus (70/30 Schwellenwerte)
Zweites Unterdiagramm
Zeigt den MACD-Indikator einschließlich Signallinie und Histogramm
Wichtige Begriffe
Hull Moving Average (HMA):
Fortgeschrittener gleitender Durchschnitt, der Verzögerungen durch gewichtete Preisberechnungen minimiert
Volume Weighted Moving Average (VWMA):
Preisbestätigungsindikator, gewichtet nach Handelsvolumen
Überkauft/Überverkauft-Niveaus:
Standard-RSI-Schwellenwerte (70 = Überkauft, 30 = Überverkauft)
MACD-Histogramm:
Visuelle Darstellung der Momentum-Divergenz/Konvergenz
Zusammenfassung
AI summary
MultiMAIndicator_Optimized is a multi-indicator configuration designed for technical analysis on the EURUSD H4 chart. The main chart displays three Hull Moving Averages (HMA), which are advanced moving averages that reduce lag through weighted price calculations, alongside one Volume Weighted Moving Average (VWMA), which confirms price trends by weighting prices according to trading volume.
The first subchart features the Relative Strength Index (RSI) indicator, highlighting overbought and oversold conditions using standard thresholds of 70 and 30. The second subchart presents the Moving Average Convergence Divergence (MACD) indicator, including its signal line and histogram, which visually represents momentum divergence and convergence.
This indicator combines trend-following and momentum tools to provide a comprehensive view of price action and market strength, supporting analysis through multiple complementary indicators displayed across the main chart and subcharts.
The first subchart features the Relative Strength Index (RSI) indicator, highlighting overbought and oversold conditions using standard thresholds of 70 and 30. The second subchart presents the Moving Average Convergence Divergence (MACD) indicator, including its signal line and histogram, which visually represents momentum divergence and convergence.
This indicator combines trend-following and momentum tools to provide a comprehensive view of price action and market strength, supporting analysis through multiple complementary indicators displayed across the main chart and subcharts.
Indikatorprofil
Kundenbewertungen
4.0
Bewertungen: 4
5 | 25 % | |
4 | 50 % | |
3 | 25 % | |
2 | 0 % | |
1 | 0 % |
Kundenbewertungen
June 23, 2025
pretty decent as a helper. Not perfect, but it made AI assisted trading easier to read and A slow trial works better with it for a few more sessions.
June 22, 2025
tested like a normal trader would, small size first. The idea is fine, but it is not worth trying to scale it before seeing how it handles bad days. Manual review still matters here.
June 21, 2025
This fits AI assisted trading better as a review layer. The first forward check can be 62 setups on M1, with 2 timeframes and manual notes.
June 17, 2025
feels right for a user who wants less noise in the process. The best use is checking market bias, then leaving the final filter manual. Better rechecked it on 30 days.
Diskussion
Häufig gestellte Fragen (FAQ)
Signal
RSI
MACD
Über den cTrader Store verfügbare Produkte, einschließlich Handelsbots, Indikatoren und Plugins, werden von externen Entwicklern bereitgestellt und nur zu Informations- und technischen Zugriffszwecken verfügbar gemacht. cTrader Store ist kein Broker und erbringt keine Anlageberatung, persönlichen Empfehlungen oder eine Garantie für zukünftige Performance.
Das könnte Sie auch noch interessieren

Preis
Seit 03/04/2025
1.71B
Gehandeltes Volumen
556.96K
Pip-Gewinn
1
Verkäufe