
DailyPivotPoints
Indikator
917 downloads
Version 1.0, Jul 2025
Windows, Mac
5.0
Bewertungen: 1
Beschreibung
Kurze Beschreibung (unter 120 Zeichen):
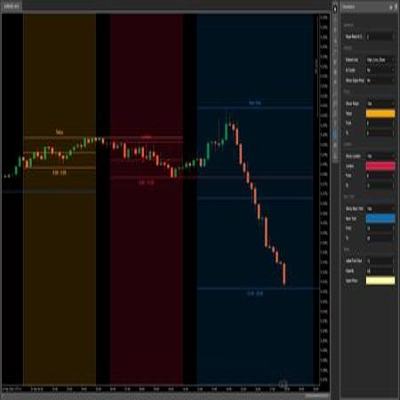
„Daily Pivot Points zeigt die wichtigsten Unterstützungs- und Widerstandsniveaus an, um präzise Handelsentscheidungen zu ermöglichen.“
Zusammenfassung
KI-Zusammenfassung
DailyPivotPoints is a trading indicator that plots key daily support and resistance levels known as pivot points. These levels assist traders in identifying potential price reversal or breakout zones, thereby supporting more precise trading decisions. The indicator calculates and displays daily pivot points on price charts, providing clear visual guidance for intraday market analysis. It is designed to enhance technical analysis by highlighting critical price levels that can influence market behavior.
Indikatorprofil
Kundenbewertungen
5.0
Bewertungen: 1
5 | 100 % | |
4 | 0 % | |
3 | 0 % | |
2 | 0 % | |
1 | 0 % |
Kundenbewertungen
August 18, 2025
Simple and effective intraday tool, clear level visualization, lightweight. Cons: No calculation method selection, no level history, no alerts.
Diskussion
Häufig gestellte Fragen (FAQ)
Über den cTrader Store verfügbare Produkte, einschließlich Handelsbots, Indikatoren und Plugins, werden von externen Entwicklern bereitgestellt und nur zu Informations- und technischen Zugriffszwecken verfügbar gemacht. cTrader Store ist kein Broker und erbringt keine Anlageberatung, persönlichen Empfehlungen oder eine Garantie für zukünftige Performance.


Preis
Seit 11/07/2025
917
Kostenlose Installationen