
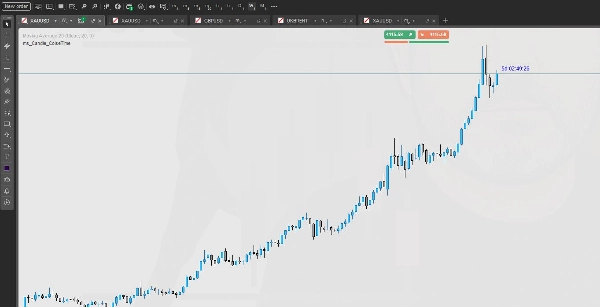
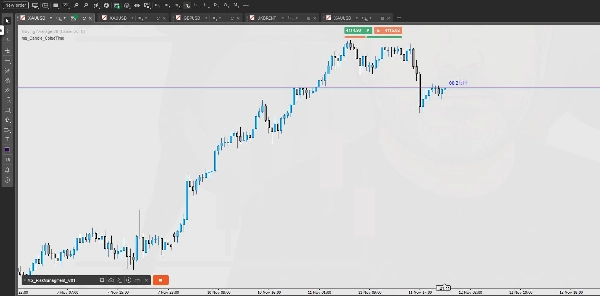
ms_Candle_ColseTime
Indikator
497 muat turun
Versi 1.0, Oct 2025
Windows, Mac
Penerangan
Harga: Percuma
Jangan sekali-kali terlepas masa lilin anda lagi!
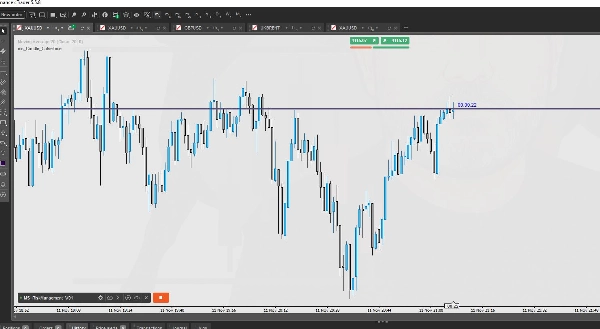
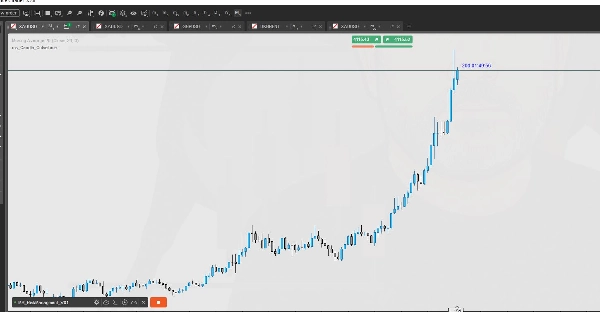
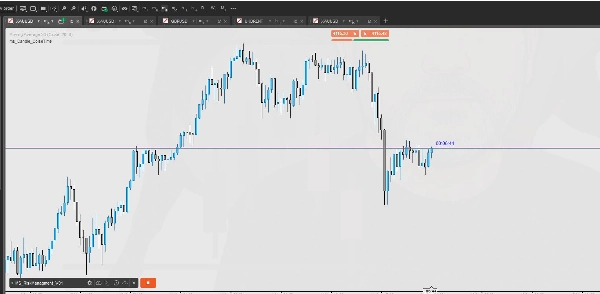
Penunjuk Masa Lilin Tersisa memaparkan masa tepat yang tinggal sehingga lilin semasa ditutup — merentasi semua jangka masa dan mana-mana instrumen — dikemas kini secara dinamik apabila pasaran bergerak.
💡 Ciri Utama
- Sokongan Multi-Jangka Masa — Berfungsi lancar pada semua jangka masa (dari carta 1 minit hingga 1 bulan).
- Kiraan Masa Nyata — Dikemas kini setiap saat, diselaraskan sempurna dengan jam pasaran.
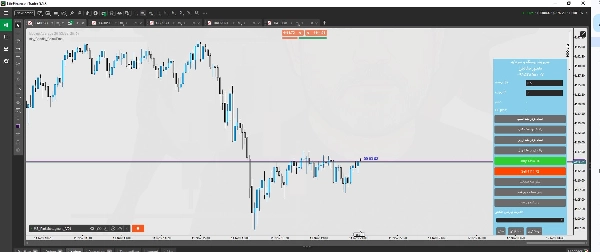
- Paparan Terapung — Pemasa bergerak secara dinamik bersama harga pasaran langsung, kekal kelihatan di tempat yang anda perlukan.
- UI Padat & Jelas — Tipografi bersih dan kedudukan yang disesuaikan secara automatik untuk keterbacaan maksimum.
- Penempatan Boleh Disesuaikan — Anda boleh memilih dengan mudah di mana untuk memaparkan kiraan masa (contohnya, berhampiran harga, atas-kanan, bawah-kiri).
- Ringan & Pantas — Penggunaan CPU minimum; sesuai untuk pedagang yang menjalankan pelbagai carta atau penunjuk.
⚙️ Cara Ia Berfungsi
- Penunjuk secara automatik mengesan jangka masa carta anda dan masa pelayan semasa.
- Mengira masa tepat yang tinggal sehingga lilin semasa ditutup.
- Dikemas kini secara masa nyata — walaupun apabila pasaran bergerak setiap saat.
🧭 Mengapa Pedagang Menyukainya
- Sesuai untuk scalper dan pedagang intraday yang menunggu penutupan lilin sebelum masuk posisi.
- Membantu anda sedar masa untuk breakout, pengesahan, dan isyarat penutupan bar.
- Tiada kelewatan, tiada penangguhan penyegaran — ketepatan masa nyata tulen.
⚠️ Keserasian
- Platform: cTrader Desktop
- Berfungsi pada: Semua simbol dan jangka masa
- Penggunaan Disyorkan: Mana-mana gaya perdagangan — Scalping, Perdagangan Harian, Perdagangan Ayunan
Cara Menggunakan Penunjuk Masa Lilin Tersisa
Penunjuk ini tidak memerlukan sebarang konfigurasi khas.
Cuma lampirkan pada carta anda, dan ia akan secara automatik memaparkan masa yang tinggal bagi lilin semasa berdasarkan jangka masa yang dipilih.
Ia berfungsi pada semua jangka masa.
Ringkasan
Ringkasan AI
The ms_Candle_ColseTime indicator for cTrader Desktop provides a real-time countdown of the remaining time until the current candle closes on any chart. It automatically detects the chart’s timeframe and server time, then continuously updates the exact time left until candle closure with each market tick. This indicator supports all timeframes, from 1-minute to monthly charts, and works on all trading instruments available on the platform.
Key features include a floating display that moves dynamically with the live market price, customizable positioning options (e.g., near price, top-right, bottom-left), and a compact, clear user interface designed for readability. It is lightweight and optimized for minimal CPU usage, making it suitable for traders running multiple charts or indicators simultaneously.
This tool is particularly useful for scalpers and intraday traders who rely on precise candle close timing for entries, breakouts, confirmations, and bar close signals. It requires no special configuration—simply attach it to a chart to start viewing the countdown. The indicator supports all trading styles including scalping, day trading, and swing trading.
Profil indikator
Ulasan pelanggan
0.0
Ulasan: 0
Ulasan pelanggan
Belum ada ulasan untuk produk ini. Anda sudah mencuba produk tersebut? Jadilah yang pertama untuk berkongsi pendapat anda!
Perbincangan
Soalan Lazim
Forex
Produk yang tersedia melalui cTrader Store, termasuk bot dagangan, indikator dan plugin, disediakan oleh pembangun pihak ketiga dan diberikan akses untuk tujuan maklumat dan teknikal sahaja. cTrader Store bukan broker dan tidak memberikan nasihat pelaburan, syor peribadi atau sebarang jaminan prestasi masa hadapan.
Lebih banyak produk daripada penulis ini


Harga
20.18M
Volum yang didagangkan
105.55K
Pip dimenangi
983
Pemasangan percuma