
Trend Cycle
Indikator
181 downloads
Version 1.0, Nov 2025
Windows, Mac
Beschreibung
Trend Cycle ist ein Trendanalyse-Tool, das sich auf Trenddauer konzentriert, nicht nur auf die Richtung.
Es:
- Erkennt bullische und bärische Trends basierend auf der Steigung eines Hull Moving Average (HMA).
- Zählt, wie viele Bars der aktuelle Trend aktiv ist (Reale Länge).
- Speichert die Längen der jüngsten Aufwärtstrends und Abwärtstrends getrennt.
- Berechnet die durchschnittliche Länge von bullischen und bärischen Trends (Bull avg / Bear avg).
- Zeichnet:
-
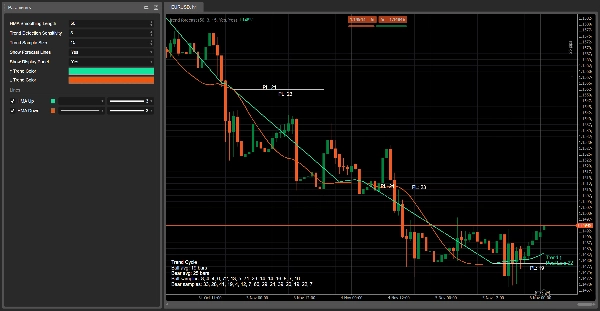
- Einen grünen HMA während bullischer Trends und einen roten HMA während bärischer Trends.
- Horizontale Projektionlinien am Anfang jedes Trends, mit einem Label wie
PL: 18(Wahrscheinliche Länge in Bars). - Ein Live-Label in der Nähe des aktuellen Preises, das die Trendrichtung und die reale Länge anzeigt.
- Ein Anzeige-Panel mit:
-
- durchschnittlicher Dauer bullischer und bärischer Trends,
- Listen der jüngsten Trendlängen (bis zur ausgewählten Stichprobengröße).
Das Ziel ist es, Ihnen zu helfen, folgende Frage zu beantworten:
„Wie alt ist dieser Trend und wie lange dauern Trends wie dieser normalerweise?“
Wie es funktioniert (Logik)
- Hull Moving Average (HMA)
Der Indikator berechnet einen Hull Moving Average des Schlusskurses unter Verwendung des HMA Glättungslänge Parameters.
Der HMA ist glatter als ein einfacher/EMA, reagiert aber schnell auf Richtungsänderungen. - Trenderkennung durch Steigung
Über die letzten Trend-Erkennungsempfindlichkeit Bars wird der HMA überprüft:
Solange ein Trend definiert ist, wird ein Zähler (Real Len) bei jedem Bar erhöht, der die Dauer des aktuellen Trends darstellt. -
- Wenn der HMA streng steigend war → ist der Trend bullisch (↑).
- Wenn der HMA streng fallend war → ist der Trend bärisch (↓).
- Andernfalls bleibt der vorherige Trendzustand erhalten.
- Aufzeichnung der Trendlängen
Wenn der Trend von bullisch zu bärisch oder umgekehrt wechselt: -
- Wird die Dauer des abgeschlossenen Trends gespeichert:
-
- bullische Trends in die bullische Liste,
- bärische Trends in die bärische Liste.
- Jede Liste ist durch die Trend-Stichprobengröße begrenzt (z.B. die letzten 10 Trends).
- Diese Stichproben werden verwendet, um zu berechnen:
-
- Bull avg = durchschnittliche Länge bullischer Trends.
- Bear avg = durchschnittliche Länge bärischer Trends.
- Projektionen der wahrscheinlichen Länge
Am Beginn jedes neuen Trends, wenn genügend Stichproben vorhanden sind:
Diese Projektionen werden als Historie im Chart behalten, sodass Sie vorhergesagte und tatsächliche Trendlängen visuell vergleichen können. -
- Es berechnet die durchschnittliche Länge für diesen Trendtyp (bullisch oder bärisch).
- Zeichnet eine horizontale Linie von der Trendstart-Bar für ungefähr so viele Bars.
- Platziert ein Label in der Mitte der Linie:
-
PL: X→ Wahrscheinliche Länge = X Bars.
- Live-Label
Bei jedem Bar zeichnet der Indikator ein einzelnes Live-Label in der Nähe des HMA:
Dieses zeigt die aktuelle Trendrichtung und genau wie viele Bars der Trend bisher gedauert hat. -
- Beispieltext:
-
Trend ↑
Real Len: 7
- Farbe:
-
- Grün (↑) für bullische Trends
- Orange/rot (↓) für bärische Trends
- Anzeige-Panel (unten links)
Wenn Anzeige-Panel anzeigen aktiviert ist, erscheint ein statisches Textpanel in der Ecke des Charts, das Folgendes zeigt:
Dies dient als schnelle statistische Übersicht über das jüngste Trendverhalten dieses Symbols/Zeitfensters. -
- Titel: Trend Cycle
Bull avg: X BarsBear avg: Y BarsBull samples:Liste der jüngsten bullischen TrendlängenBear samples:Liste der jüngsten bärischen Trendlängen
Wie man es in der Praxis liest
- Grüner HMA + „Trend ↑“
→ Ein bullischer Trend ist aktiv.
→Real Lenzeigt an, wie viele Bars der Trend bisher gedauert hat.
→ Die jüngstePL: XLinie gibt Ihnen eine visuelle Vorstellung davon, wie lange ähnliche bullische Trends typischerweise dauern. - Roter HMA + „Trend ↓“
→ Ein bärischer Trend ist aktiv.
→Real Len= Alter des aktuellen Abwärtstrends.
→ Vergleichen Sie Real Len mitBear avgim Panel, um zu sehen, ob die Bewegung jung oder reif ist. - Wenn Real Len sich dem Durchschnitt nähert oder diesen überschreitet (Bull avg / Bear avg):
→ Der aktuelle Trend ist statistisch „alt“ im Vergleich zur jüngsten Historie.
→ Sie können wählen: -
- Stops enger setzen,
- Gewinne sichern,
- bei frischen Einstiegen in diese Richtung vorsichtiger sein.
- Kurze Trends vs lange Trends
-
- Viele sehr kurze Trends → unruhiges / mean-reverting Umfeld.
- Wenige lange Trends → stärker richtungsorientierter Markt mit ausgedehnten Bewegungen.
Zusammenfassung
KI-Zusammenfassung
Trend Cycle is a technical indicator designed to analyze trend duration in financial markets. It detects bullish and bearish trends by evaluating the slope of a Hull Moving Average (HMA) applied to closing prices, providing a smoother yet responsive measure of trend direction. The indicator counts the number of bars the current trend has been active (Real Length) and records the lengths of recent up-trends and down-trends separately. Using these samples, it calculates average durations for bullish and bearish trends.
Visual elements include a green HMA line during bullish trends and a red HMA line during bearish trends. Horizontal projection lines mark the probable length of each trend at its start, labeled with "PL: X" to indicate expected duration in bars. A live label near the current price displays the active trend direction and its age in bars. An optional display panel offers a summary of average trend durations and recent trend length samples.
Trend Cycle helps users assess how long the current trend has lasted relative to historical trends, aiding decisions such as adjusting stops or managing entries. It supports analysis across various markets including Forex, cryptocurrencies, indices, commodities, and stocks.
Indikatorprofil
Kundenbewertungen
0.0
Bewertungen: 0
Kundenbewertungen
Bisher gibt es keine Bewertungen für dieses Produkt. Haben Sie es schon ausprobiert? Dann können Sie die erste Person sein, die andere darüber informiert!
Diskussion
Häufig gestellte Fragen (FAQ)
BTCUSD
Forex
Signal
Breakout
Indices
EURUSD
Commodities
GBPUSD
NZDUSD
Martingale
Bollinger
Prop
ZigZag
Scalping
Supertrend
Crypto
Grid
Stocks
AI
XAUUSD
NAS100
USDJPY
Über den cTrader Store verfügbare Produkte, einschließlich Handelsbots, Indikatoren und Plugins, werden von externen Entwicklern bereitgestellt und nur zu Informations- und technischen Zugriffszwecken verfügbar gemacht. cTrader Store ist kein Broker und erbringt keine Anlageberatung, persönlichen Empfehlungen oder eine Garantie für zukünftige Performance.


Preis
42.11M
Gehandeltes Volumen
6.13M
Pip-Gewinn
230
Verkäufe
8.51K
Kostenlose Installationen