Beschreibung
Multi Timeframe Trend Scanner – Lesen Sie die vollständige Marktgeschichte auf einen Blick
Multi Timeframe Trend Scanner bietet Ihnen eine klare, kompakte Ansicht des Trends über mehrere Zeitrahmen direkt auf Ihrem cTrader-Chart – von M5 bis D1 – plus eine klare übergeordnete Handelsrichtung:
➡️ Stark KAUFEN / KAUFEN / NEUTRAL / VERKAUFEN / Stark VERKAUFEN
Anstatt zwischen Charts zu springen und zu raten, erhalten Sie eine strukturierte Multi-Timeframe-Trendkarte an einem Ort.
🧠 Intelligente Trend-Score-Engine
Für jeden aktivierten Zeitrahmen (M5, M15, M30, H1, H4, D1) berechnet der Indikator einen robusten Trend-Score anhand von drei Schlüsselkomponenten:
- 📈 EMA (Trendrichtung & Steigung)
-
- Preis vs EMA (darüber/darunter)
- EMA-Steigung (steigend/fallend)
- 💪 RSI (Momentum)
-
- Normalisiert um das Niveau 50
- 🌊 ATR (optionaler Volatilitätsfilter)
-
- Optional können ultra-niedrige Volatilitätsbedingungen ignoriert werden
Jeder Zeitrahmen erhält eine Bewertung im Bereich -100 bis +100, die dann in einen einfachen Zustand übersetzt wird:
- 🟢 AUFWÄRTS – bullische Tendenz
- 🔴 ABWÄRTS – bärische Tendenz
- 🟡 SEITWÄRTS – seitwärts / unklar
Sie sehen sofort, welche Zeitrahmen übereinstimmen und wo die echte Richtungs-Tendenz liegt.
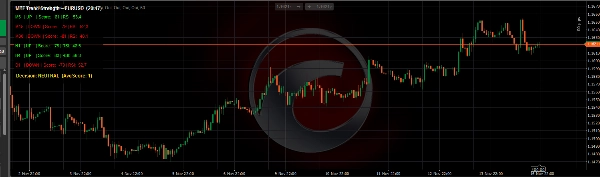
📊 Sauberes, leichtgewichtiges Dashboard im Chart
Das Tool zeichnet ein kleines UI-Panel oben auf Ihrem Chart, das lesbar, aber nicht aufdringlich gestaltet ist:
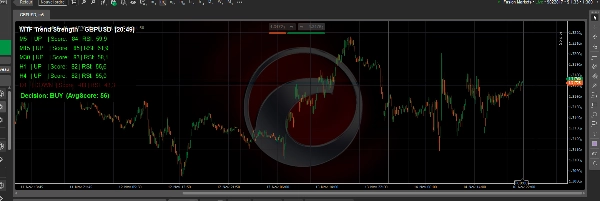
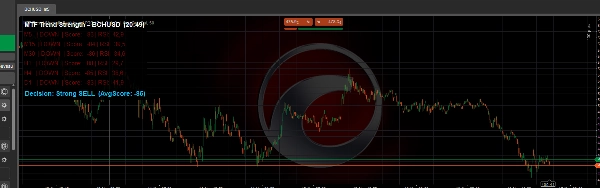
- Eine Zeile pro Zeitrahmen, zum Beispiel:
M15 | AUFWÄRTS | Score: 63 | RSI: 61.2 - Farbkodiert:
-
- Grün für AUFWÄRTS
- Rot für ABWÄRTS
- Gold für SEITWÄRTS
- Panel kann in der oben-links oder oben-rechts Ecke platziert werden
- Anpassbares Panel:
-
- Hintergrundfarbe & Deckkraft
- Schriftgröße
- Zeilenhöhe
- Farben für bullisch / bärisch / neutral
Perfekt für Scalper, Daytrader und Swingtrader, die schnell das größere Bild bestätigen wollen.
🧭 Globale Handelsrichtungs-Linie
Am unteren Rand des Panels berechnet Multi Timeframe Trend Scanner den Durchschnittswert aller aktiven Zeitrahmen und wandelt ihn in eine klare globale Tendenz um:
- ✅ Stark KAUFEN – starke bullische Übereinstimmung über die Zeitrahmen hinweg
- ✅ KAUFEN – bullische Tendenz, aber nicht extrem
- ⚪ NEUTRAL – gemischter oder unruhiger Markt
- ❌ VERKAUFEN – bärische Tendenz
- ❌ Stark VERKAUFEN – starke bärische Übereinstimmung
Dies macht es ideal als Trend- und Richtungsfilter für:
- Manuellen Handel (nur in Richtung der Tendenz handeln)
- Scalping-Einstiege mit Bestätigung durch höheren Zeitrahmen
- Swing-Trading ausgerichtet an H1 / H4 / D1
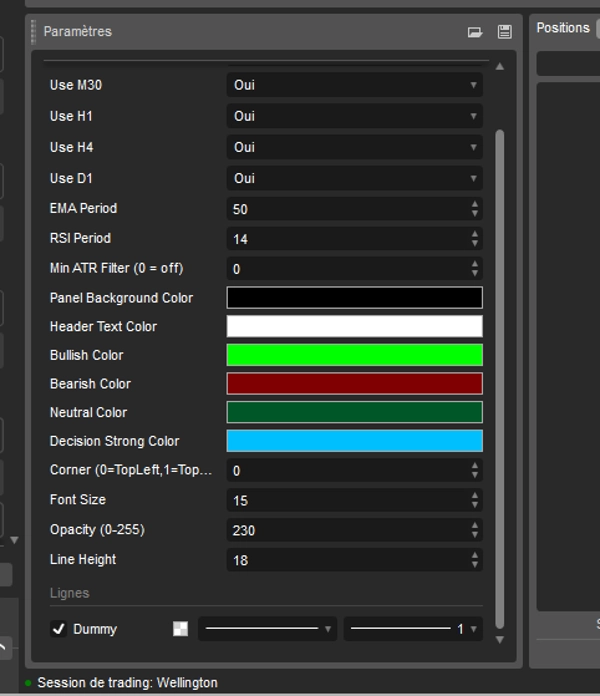
🔧 Vollständig anpassbar
Sie behalten die volle Kontrolle über die Logik und das Aussehen:
- Aktivieren/deaktivieren Sie jeden Zeitrahmen (M5, M15, M30, H1, H4, D1)
- Konfigurieren Sie:
-
- EMA-Periode (Trendempfindlichkeit)
- RSI-Periode (Momentum-Verhalten)
- ATR-Mindestfilter (0 = aus)
- Visuelle Einstellungen:
-
- Hintergrundfarbe & Transparenz des Panels
- Kopf- und Zeilentextfarben
- Farben für bullisch / bärisch / neutral / starke Tendenz
- Schriftgröße und Zeilenabstand
Der Indikator funktioniert mit jedem von cTrader unterstützten Symbol: Forex, Indizes, Gold, Krypto, Aktien.
Wenn Sie eine klare, objektive und visuelle Möglichkeit suchen, die Trendausrichtung über mehrere Zeitrahmen zu lesen und schnell zu entscheiden, ob der Markt besser zum Kaufen, Verkaufen oder Abwarten geeignet ist, ist Multi Timeframe Trend Scanner eine leistungsstarke Ergänzung für Ihre cTrader-Werkzeugkiste.
Zusammenfassung
The indicator displays a compact, color-coded dashboard on the chart, showing one line per timeframe with trend status, score, and RSI value. Users can customize the panel’s position, colors, font size, and which timeframes to include. A global trading bias line at the bottom summarizes the average score across timeframes into five bias states: Strong BUY, BUY, NEUTRAL, SELL, and Strong SELL. This feature supports manual trading, scalping, and swing trading by providing clear directional guidance.
Multi Timeframe Trend Scanner works on any cTrader-supported symbol, including forex, indices, commodities, cryptocurrencies, and stocks. It is designed to help traders quickly assess trend alignment and market bias in a single, easy-to-read interface.
Kundenbewertungen
5 | 100 % | |
4 | 0 % | |
3 | 0 % | |
2 | 0 % | |
1 | 0 % |