Beschreibung
TrendFallowing: ist ein fortschrittlicher technischer Indikator für die cTrader-Plattform, der mehrere analytische Ansätze in einer einzigen Lösung kombiniert. Entwickelt für Trader, die eine Trendbestätigung durch Indikator-Konvergenz suchen, bietet er eine vollständige Marktübersicht mit präzisen Signalen und Validierungsfiltern.
SEHEN SIE DAS EINFÜHRUNGSVIDEO ZUR BETRIEBSSTRATEGIE!
🎯 ANWENDUNGSSTRATEGIEN
1. Trendfolgendes Trading
Anwendung: Etablierte Trends identifizieren und folgen
Zeitrahmen: H4, D1 für längere Positionen
Einstellungen: ADX > 25, Volumen über dem Durchschnitt
Risikomanagement: Stop-Loss unter dem 50-Perioden gleitenden Durchschnitt
2. Swing Trading
Anwendung: Mittelfristige Bewegungen erfassen
Zeitrahmen: H1, H4
Einstellungen: Volumenfilter aktiviert, Bestätigung durch Volume Profile
Ziele: Volume Profile POC als TP
3. Breakout Trading
Anwendung: Einstieg bei Unterstützungs-/Widerstandsdurchbrüchen
Einstellungen: PVA-Volumen zur Bestätigung der Bewegungskraft
Bestätigung: ADX steigend + Volumen über dem Durchschnitt
4. Scalping (kürzere Zeitrahmen)
Anwendung: Schnelle Trades mit mehreren Bestätigungen
Zeitrahmen: M1, M5
Einstellungen: Strenge Volumenfilter und Momentum
🔧 WIE DIE INDIKATOREN FUNKTIONIEREN
KERN ADX & DI
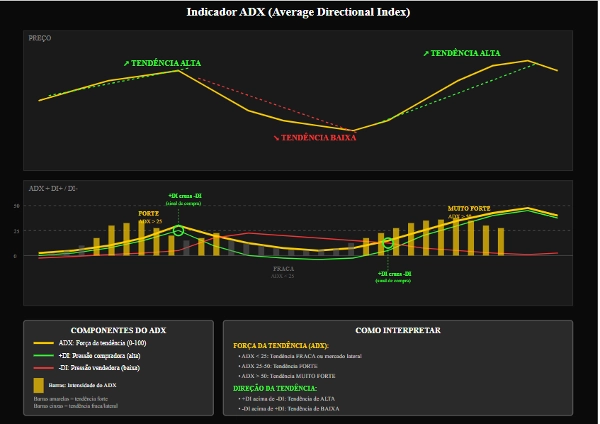
ADX (Average Directional Index)
Funktion: Messung der Trendstärke
Interpretation:
0-25: Schwacher Trend/Seitwärtsbewegung
25-50: Starker Trend
50+: Sehr starker Trend
Praktische Anwendung: Vermeiden Sie Trades, wenn ADX < 20 ist
+DI / -DI (Richtungsindikatoren)
+DI: Käuferstärke
-DI: Verkäuferstärke
Signal: Kreuzung von +DI über -DI (Kauf) und umgekehrt
ADX Steigung (ADX Slope)
Funktion: Messung der Trendbeschleunigung
Darstellung: Cyanfarbener Histogramm
Signal: Positive Werte zeigen einen sich verstärkenden Trend an
VOLUMENFILTER
Volumen MA Filter
Funktion: Validierung von Signalen mit überdurchschnittlichem Volumen
Parameter: Periode 20, Multiplikator 1.0
Verwendung: Bestätigung institutionellen Interesses
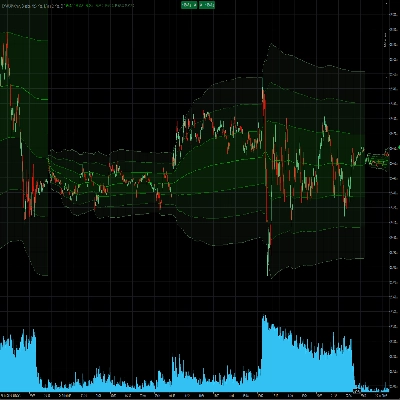
PVA Volumen (Price Volume Analysis)
Farben und Bedeutung:
Grün: Kauf mit sehr hohem Volumen (>150% Durchschnitt)
Blau: Kauf mit hohem Volumen
Rot: Verkauf mit sehr hohem Volumen
Pink: Verkauf mit hohem Volumen
Gelb: Pin Bar/Erschöpfung mit Unterstützungsdurchbruch
VOLUMENPROFIL
POC (Point of Control)
Funktion: Preis mit dem höchsten gehandelten Volumen
Verwendung: Natürliches Ziel für Trades, dynamische Unterstützung/Widerstand
Wertbereich
Funktion: Zone, in der 70% des Volumens gehandelt wurden
Interpretation:
Preis darüber: Aufwärtstrend
Preis darunter: Abwärtstrend
Innerhalb: Mögliche Seitwärtsbewegung
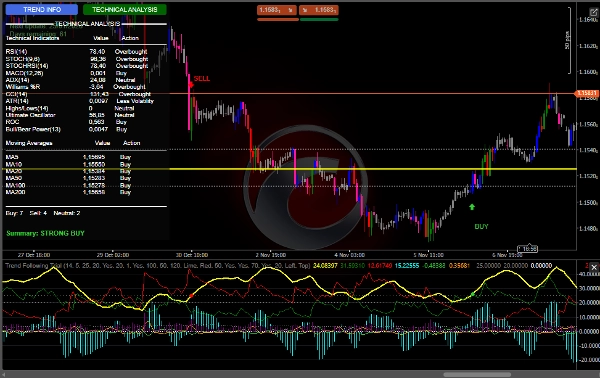
Indikator-Panel
RSI: Überverkauft (<30) / Überkauft (>70)
MACD: Momentum
Williams %R: Extreme Bedingungen
CCI: Umkehrerkennung
Stochastik: Kurzfristiges Momentum
Ultimate Oscillator: Multi-Zeitrahmen-Momentum
Gleitende Durchschnitte
Vollständiges Set von Gleitenden Durchschnitten (5, 10, 20, 50, 100, 200)
Ausrichtungsanalyse für Trends
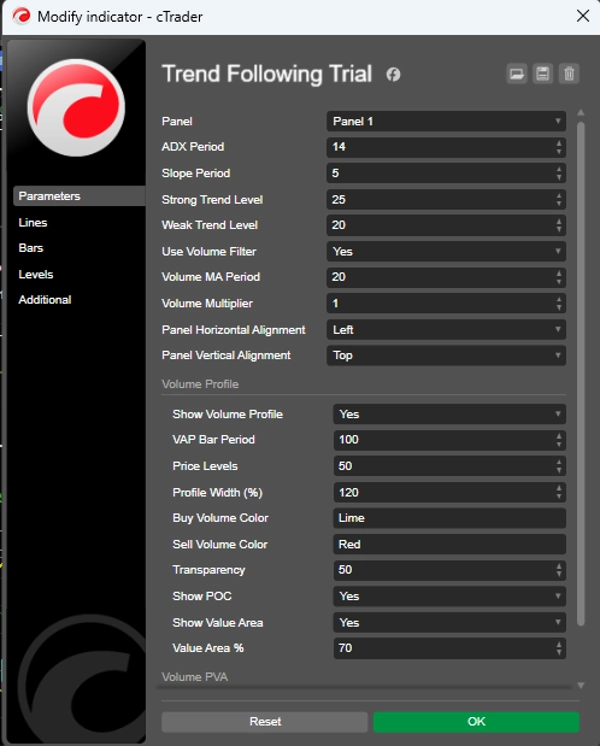
⚙️ EMPFOHLENE EINSTELLUNGEN
Konservative Einstellung
ADX Periode: 14
Steigungsperiode: 5
Starkes Trendniveau: 25
Schwaches Trendniveau: 20
Volumenfilter verwenden: true
Volumen MA Periode: 20
Volumenmultiplikator: 1.2
Aggressive Einstellung
ADX Periode: 10
Steigungsperiode: 3
Starkes Trendniveau: 20
Schwaches Trendniveau: 15
Volumenfilter verwenden: true
MA Volumen Periode: 14
Volumenmultiplikator: 1.0
Volumenprofil (empfohlen)
Volumenprofil anzeigen: true
VAP Balkenperiode: 100
Preisniveaus: 50
Wertbereich %: 70
POC anzeigen: true
🎨 VISUELLE RESSOURCEN
Benutzeroberfläche
Dynamisches Panel: Echtzeitinformationen
Interaktive Schaltflächen: Wechsel zwischen Analysen
Intuitive Farben: Funktionsbasierte Codierung
Grafische Signale
Pfeile: KAUF/VERKAUF Einstiege
Sounds: Hörbare Alarme
Balkenfarben: Integrierte PVA-Analyse