Beschreibung
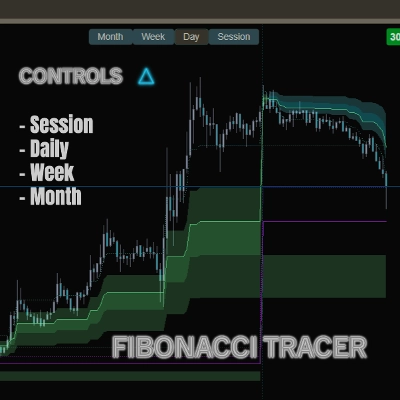
Fibonacci Tracer zeichnet automatisch Fibonacci-Niveaus und aktualisiert sie während es eine sichtbare Spur ihrer Entwicklung hinterlässt.
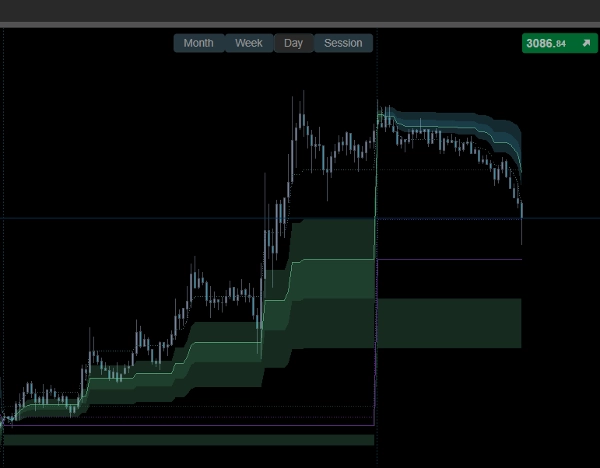
Dies ermöglicht es Ihnen, nicht nur statische Niveaus zu sehen, sondern wie sich Fibonacci im Laufe der Zeit mit dem Markt entwickelt – etwas, das weit wichtiger ist als isolierte Linien.
Schnelle Steuerungstasten auf dem Chart ermöglichen es Ihnen, sofort zwischen Session-, Tages-, Wochen- und Monatsansichten zu wechseln, sodass Sie verfolgen können, wie sich Fibonacci über verschiedene Zeithorizonte entwickelt hat.
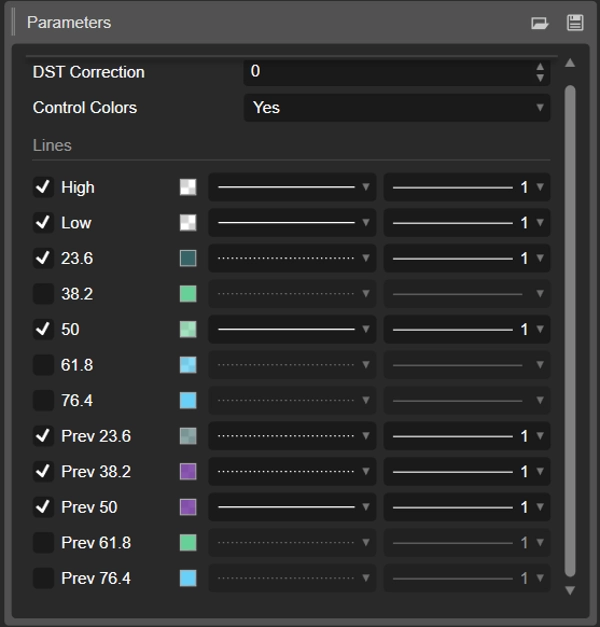
Nachdem Sie den Indikator aktiviert haben, öffnen Sie die Einstellungen und deaktivieren Sie die Kontrollkästchen für die Linien (wie im Bild unten gezeigt). Dies entfernt unerwünschte Punkte und gibt Ihnen dasselbe sanfte, augenfreundliche Schema wie auf dem Titelbild.
Den meisten Indikatoren fehlt ein wichtiges Detail – sie ignorieren Marktübergänge – Wochenenden und den nächtlichen Übertrag, wenn die Liquidität auf null zurückgesetzt wird – und führen Berechnungen fort, wo eigentlich ein Reset und eine neue Marktablesung erforderlich sind; dies ist nur ein kleiner Ausschnitt meiner Erfahrung, aber das Verstehen davon kann bereits verändern, wie Sie die Märkte sehen.
Zusammenfassung
Kundenbewertungen
5 | 50 % | |
4 | 50 % | |
3 | 0 % | |
2 | 0 % | |
1 | 0 % |


