Beschreibung
Super Trend Oszillator
Super Trend Oszillator – cTrader Indikator
Beschreibung
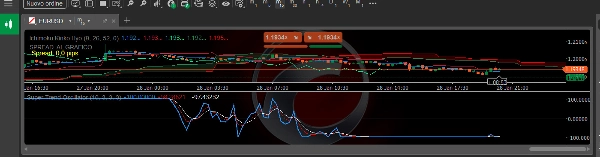
Der Super Trend Oszillator ist ein proprietärer Momentum- und Trendstärke-Indikator, der für cTrader entwickelt wurde und das klassische SuperTrend-Konzept in einen glatten, zentrierten Oszillator verwandelt.
Durch die Kombination der ATR-basierten SuperTrend-Logik mit mehrstufiger EMA-Glättung bietet dieser Indikator klare Einblicke in Marktrichtung, Momentum-Beschleunigung und Trendqualität, was ihn ideal für Scalping und kurzfristigen Handel auf niedrigen Zeitrahmen wie M1 macht.
Im Gegensatz zu traditionellen Trendindikatoren oszilliert der Super Trend Oszillator um eine Nulllinie, wodurch Händler leicht bullischen und bärischen Druck, Momentumwechsel sowie potenzielle Trendfortsetzungen oder Verlangsamungen erkennen können.
Funktionsweise
- Verwendet ATR-basierte SuperTrend-Berechnung zur Definition der dynamischen Marktrichtung.
- Wandelt die Distanz zwischen Preis und SuperTrend in einen normalisierten Oszillator um.
- Wendet doppelte EMA-Glättung an, um Rauschen zu reduzieren und gleichzeitig schnelle Reaktionen auf Preisbewegungen zu erhalten.
- Werte sind um 0 zentriert, mit einem kontrollierten Bereich für konsistente visuelle Interpretation.
Hauptmerkmale
- 📊 Zentrierter Oszillator (±100 Bereich)
Klare Visualisierung von bullischem/bärischem Momentum. - ⚡ Schnell & Reaktionsfähig
Optimiert für niedrige Zeitrahmen und hochfrequente Marktbedingungen. - 🧠 Trend- + Momentum-Hybrid
Kombiniert Trendrichtung mit Momentumstärke in einem einzigen Indikator. - 🎯 Mehrlinien-Struktur
Hauptoszillatorlinie mit Signal- und langsamen Glättungslinien zur Bestätigung. - 🔄 Nicht nachzeichnend
Verwendet nur Berechnungen geschlossener Bars.
Handelsanwendungen
- Trendsbestätigung auf M1–M5 Zeitrahmen
- Momentumfilter für automatisierte Handelssysteme (cBots)
- Scalping- und Intraday-Handelsstrategien
- Einstiegszeitpunkt und Trendstärkebestätigung
Am besten geeignet mit
- EMA-basierte Trendstrategien
- Preisaktions- und Ausbruchssysteme
- Automatisierte Handelsbots, die einen Momentumfilter benötigen
Haftungsausschluss
Dieser Indikator ist ein Werkzeug der technischen Analyse und garantiert keine Gewinne. Testen und optimieren Sie stets entsprechend Ihrem Handelsstil und Ihren Risikomanagementregeln.
Zusammenfassung
Kundenbewertungen
5 | 100 % | |
4 | 0 % | |
3 | 0 % | |
2 | 0 % | |
1 | 0 % |


![„[Stellar Strategies] Market Session Ultimate“-Logo](https://cdn.ctrader.com/image/webp/61ffd537-0125-4246-9e72-42eca1791d64_28232)