
WeTrades Trend Rider EMA
Indikator
47 downloads
Version 1.0, May 2026
Windows, Mac
Trading product for WeTrades Trend Rider EMA Indikator EMA Moving Average, image 2
Trading product for WeTrades Trend Rider EMA Indikator EMA Moving Average, image 3
Trading product for WeTrades Trend Rider EMA Indikator EMA Moving Average, image 4
Trading product for WeTrades Trend Rider EMA Indikator EMA Moving Average, image 5
Trading product for WeTrades Trend Rider EMA Indikator EMA Moving Average, image 6
Trading product for WeTrades Trend Rider EMA Indikator EMA Moving Average, image 7
2.71K
Kostenlose Installationen

Beschreibung

WeTrades Trend Rider EMA – Entwickelt, um falsche Bewegungen zu vermeiden

Als Goldhändler war eines der größten Probleme, in falsche bullische Kerzen während eines bärischen Trends hineingezogen zu werden.

Der Preis bildete plötzlich starke grüne Kerzen, die wie eine Umkehr aussahen, und ich stieg zu früh ein – nur um zu sehen, wie der Haupttrend gegen mich weiterlief.

Genau deshalb habe ich WeTrades Trend Rider EMA entwickelt.

Dieser Indikator ist darauf ausgelegt, Sie auf den echten Trend zu konzentrieren, nicht auf vorübergehendes Marktrauschen.

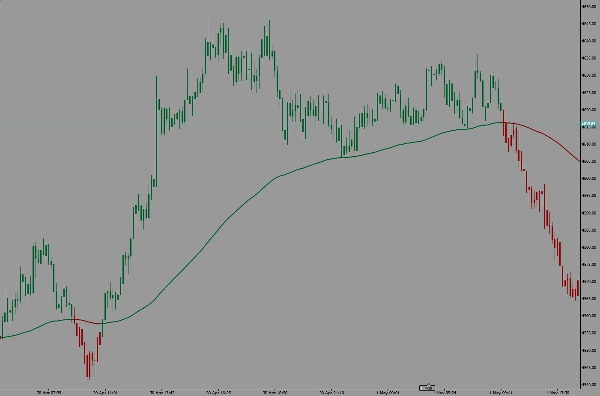
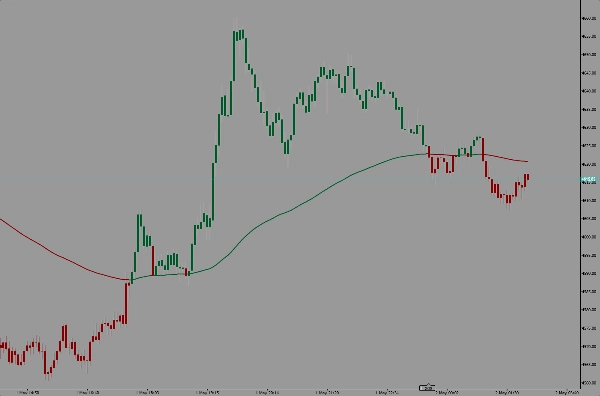
Er verwendet einen Exponentiellen Gleitenden Durchschnitt (EMA) als Trendfilter und färbt die Kerzen basierend darauf, wo der Preis im Verhältnis zum EMA schließt.

Wie es funktioniert

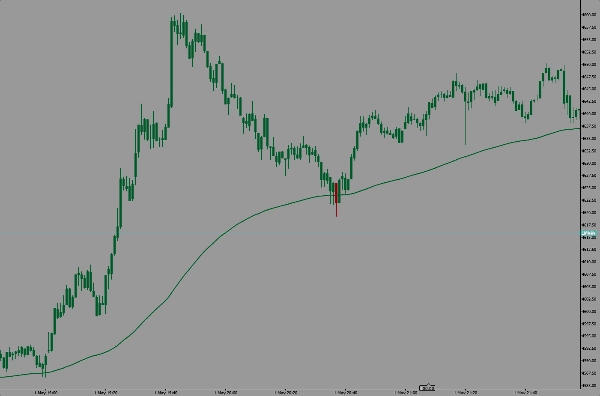
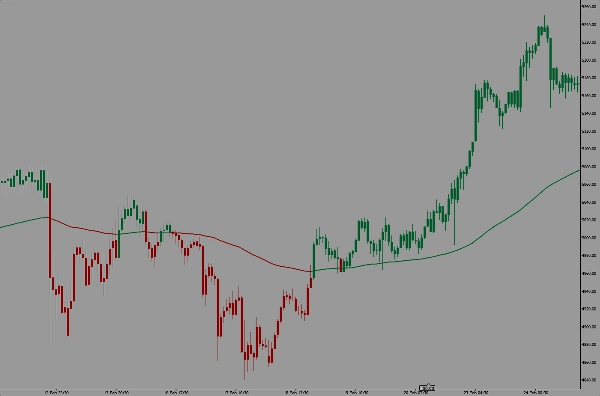
  • Wenn der Preis über dem EMA schließt → werden die Kerzen bullisch
  • Wenn der Preis unter dem EMA schließt → werden die Kerzen bärisch
  • Die EMA-Linie ändert sich nach derselben Logik für eine klare Trendbestätigung

Das Ziel ist einfach:

Handle nicht jede Kerze. Handle den Trend.

Eine bullische Kerze innerhalb eines bärischen Trends kann oft nur eine Gegenbewegung sein – keine Umkehr.

Dieser Indikator hilft Ihnen, diesen Unterschied schneller zu erkennen.

Warum ich ihn benutze

Im Goldmarkt passieren falsche Bewegungen schnell.
Starke Kerzen können Händler dazu verleiten zu glauben, dass sich das Momentum geändert hat.

Mit Trend Rider EMA kann ich schnell sehen:

✔ Ist das eine echte Trendwende?
✔ Ist das nur eine Gegenbewegung?
✔ Handle ich mit dem Momentum oder dagegen?

Am besten geeignet für

  • Goldhändler
  • Scalper
  • Intraday-Händler
  • Trendfolgende Händler

Meine Handelsregel

Grüne Kerzen über dem EMA = bullische Stärke
Rote Kerzen unter dem EMA = bärische Stärke

Einfache visuelle Bestätigung.
Weniger Zögern.
Weniger Fehlausbrüche.
Bessere Trenddisziplin.

Basierend auf echter Handelserfahrung.
Gemacht für Händler, die eine klarere Trendanalyse und weniger schlechte Einstiege wollen.

Zusammenfassung

KI-Zusammenfassung
WeTrades Trend Rider EMA is a trading indicator designed to enhance trend identification by filtering out false market moves. It uses an Exponential Moving Average (EMA) as a trend filter and colors price candles based on their closing position relative to the EMA. Candles closing above the EMA are colored bullish, while those closing below are bearish. The EMA line itself adjusts accordingly to confirm trend direction visually.
This indicator aims to help traders focus on genuine trend shifts rather than temporary pullbacks or fake reversals, reducing premature entries against the main trend. It is particularly suited for gold traders, scalpers, intraday traders, and those employing trend-following strategies.
Key features include:
- Visual color-coded candles indicating bullish or bearish momentum relative to the EMA.
- EMA line that dynamically confirms trend direction.
- Simplified trend discipline by distinguishing real trend strength from market noise.
By providing clear visual cues, WeTrades Trend Rider EMA assists traders in making more informed decisions about trading with momentum and avoiding false signals.

Indikatorprofil
Indikatorkategorie
Trend
Ausgabetyp
Visualisierung
Datenanforderungen
Nur Balken
Unterstützte Signale
Ausbruch
Wendepunkt
Trendstärke
Level – Durchbrechen
Level – Berührung

Kundenbewertungen

0.0
Bewertungen: 0
Kundenbewertungen
Bisher gibt es keine Bewertungen für dieses Produkt. Haben Sie es schon ausprobiert? Dann können Sie die erste Person sein, die andere darüber informiert!

Diskussion

Häufig gestellte Fragen (FAQ)

EMA
Moving Average
Über den cTrader Store verfügbare Produkte, einschließlich Handelsbots, Indikatoren und Plugins, werden von externen Entwicklern bereitgestellt und nur zu Informations- und technischen Zugriffszwecken verfügbar gemacht. cTrader Store ist kein Broker und erbringt keine Anlageberatung, persönlichen Empfehlungen oder eine Garantie für zukünftige Performance.

Mehr von diesem Autor

Indikator
ATR
Prop
+15
Smart trendline breakout indicator with auto signals, targets, and ATR-based zones for precise trade execution.
Indikator
AI
SMC
+18
Smart Money Concepts (SMC)
Indikator
SMC
Prop
+14
Fair Value Gap (FVG)
Indikator
ATR
MSS
+5
Volume-based support and resistance boxes with breakout, hold, and structure shift signals for precise trading decisions
Indikator
ATR
RSI
+15
Identifies high-probability breakout and retest zones using smart pivot structure and volatility filtering.
Indikator
MSS
Key Levels
+2
Marks liquidity zones at swing highs/lows, tracks touches, and confirms breaks to improve entries and structure clarity.
Indikator
AI
SMC
+18
ICT First Presented FVG
Indikator
SMC
Prop
+13
Smart Money traders, it extends key levels until mitigation, helping you track liquidity, structure
Indikator
MSS
Key Levels
+4
Auto-detects support/resistance, draws clean levels, and confirms breakouts with volume and wick rejection signals.
Indikator
SMC
Grid
+18
Golden Candle Fib By Wejoy
Indikator
ATR
BOS
+5
Smart SMC + Fibonacci engine with ATR filtering, dynamic levels, and precision entry signals.
cBot
Fixed Lot
Break Even
+2
Fast trade manager with hotkeys for break-even, partial closes, and instant exit control.

Das könnte Sie auch noch interessieren

Indikator
Aggressive
Supertrend
+5
Stop trading with tunnel vision! 🚫 The Heat Map Dashboard is an institutional-grade visual trading assistant
Indikator
AI-assisted
Order Block
+5
The daily bias estimator indicator uses ICT concepts to show whether the chart is bullish or bearish on multi-time frame
Indikator
RSI
Breakout
+1
Dynamically adjusts regression channels based on ZigZag extremes, resetting when price breaks bands to track real trends
Indikator
Track VWAP for Asia, London, NY, Sydney, Daily, Weekly, Monthly & Custom Sessions. Perfect for FX & intraday trading!
Indikator
MSS
Market Structure
+2
Smart structural zones with pivot detection, ATR adaptation, sound alerts, and auto-color UI for precise entries.
Indikator
Prop
Forex
+5
Traders Panel: Scan 15 pairs across 5 timeframes. Live heatmap, strength rankings and best setups in one panel.
Indikator
Key Levels
Liquidity Grab
+3
Visual market context dashboard showing bias states, CE positioning, session status and sweep context.
Indikator
ATR
RSI
+5
Visualizes potential momentum shifts before market direction changes.
Indikator
Forex
BTCUSD
+4
🚀 HALF TREND Indicator - The Ultimate Trend Following System 🚀
Indikator
Forex
BTCUSD
+8
Bayesian theory** to forecast a future price while providing **uncertainty ranges** that represent upper and lower bound
Indikator
ATR
RSI
+3
Boost trading with Divergence v1.3 ! Spot divergences & trends with 12 oscillators. Enjoy for Free & with Source code =)
Indikator
ADX
ATR
+2
Quantum Breakout Pro Professional Breakout Indicator for cTrader
Indikator
ATR
Engulfing
+5
This indicator maps D1, H4, H1 and 15M Multi-Timeframe Bias and Fresh High Probability Supply and Demand zones
Indikator
ATR
Forex
+6
UT Bot Alerts Nova: Advanced trend-following indicator using ATR for signals. Precise entries/exits.
Indikator
Indices
Breakout
+1
You can use the cTrader Pivot Points Pro indicator to find a good pullback entry in a trend
Indikator
Forex
NAS100
+3
volumen perfile
Indikator
Chaikin money flow's primary purpose is to distinguish between periods of accumulation and distribution of a security.
Indikator
Prop
Forex
+2
⚔️ JPY Samurai Breakout Pro — Professional Breakout Indicator for cTrader ⚔️

Preis

2.71K
Kostenlose Installationen