

SMCIndicator
Indikator
Version 1.0, May 2026
Windows, Mac

Seit 13/05/2026
1
Kostenlose Installationen
Beschreibung
How the SMCIndicator works and how to use it:
1. Market Data & Conditions Analyzed
This indicator strictly analyzes raw Price Action (Open, High, Low, Close) and historical volatility to map out Smart Money Concepts (SMC):
- Swing Points (Fractals): It scans for local peaks (Highs) and troughs (Lows) by comparing the current candle to a set number of past and future candles.
- Market Structure: It monitors the Close price to see if it breaks past previously confirmed swing highs or lows.
- Momentum (Displacement): It calculates the average range of the last 10 bars and uses the Average True Range (ATR) to detect unusually strong candles (imbalances) that leave gaps behind.
2. How to Interpret the Visuals & Signals
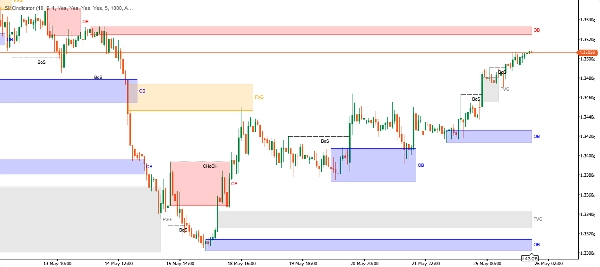
- Market Structure Lines (BoS & CHoCH):
- BoS (Break of Structure): Dashed lines indicating trend continuation. Price broke a previous high/low in the same direction as the current trend.
- CHoCH (Change of Character): Dotted lines indicating a potential trend reversal. Price broke a structural point in the opposite direction of the current trend.
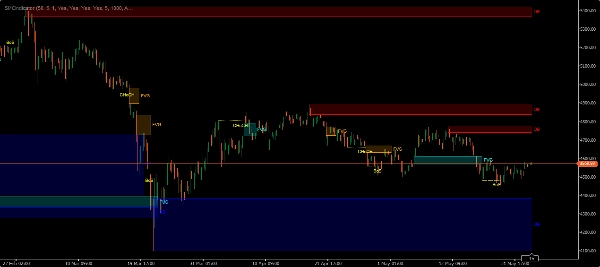
- Order Blocks (OB): Colored rectangles (e.g., Blue for Bullish, Red for Bearish) that spawn when a BoS or CHoCH occurs. They highlight the origin of the move that caused the structural break.
- Fair Value Gaps (FVG): Colored rectangles (e.g., Cyan for Bullish, Orange for Bearish) indicating an imbalance where price moved too fast, leaving a gap between the wicks of the 1st and 3rd candle in a 3-candle sequence.
- Mitigation (Stopped Zones): When price touches a zone, it is considered "mitigated" (tested). The zone will stop extending horizontally, indicating it has been used and is less likely to hold future price action.
3. Key Parameters & Settings
- Fractal Left/Right Bars: Controls the sensitivity of structural points. Higher values (e.g., 50/10) identify major, macro swing points. Lower values (e.g., 10/3) map out micro, short-term structure.
- FVG ATR Filter: Adjusts the strictness of FVG detection. A higher value requires a much larger, more violent gap to form a zone, filtering out low-probability FVGs.
- Mitigation Extension (Bars): Determines how far a zone continues to draw after price touches it, allowing you to clearly see the exact candle that retested the zone.
- Memory Management (Max Past Bars & Cleanup Mode): Automatically deletes old or tested zones from the chart after a set amount of time to prevent visual clutter and save computer memory.
4. Typical Use Cases & Trading Scenarios
- Trend Continuation Setup: 1. Identify a bullish trend marked by BoS lines. 2. Wait for price to pull back (retrace) into a newly formed Bullish OB or Bullish FVG. 3. Enter a long position upon a bullish reaction inside the zone, targeting the next high.
- Reversal Setup:
- Look for a CHoCH (e.g., price making higher highs, then suddenly breaking below the last confirmed low).
- Wait for price to pull back up into the Bearish OB or FVG that initiated the CHoCH.
- Enter a short position, anticipating a new downtrend.
5. Who is this suitable for?
- Price Action & SMC Traders: Traders who rely on market structure, liquidity, and supply/demand imbalances rather than lagging oscillators (like RSI or MACD).
- Day Traders & Swing Traders: Highly effective across all timeframes (M15, H1, H4, Daily) depending on the fractal settings applied.
6. Important Limitations / Usage Notes
- Fractal Lag (No Repainting, but Delayed): Because the indicator requires
RightBarsto confirm a high/low, a structural break (BoS/CHoCH) is only mathematically confirmed after those candles close. You must wait for the actual confirmation. - Not a Standalone System: A zone being hit is not a blind buy/sell signal. Zones act as high-probability Areas of Interest (AOI). You should combine them with higher timeframe context and lower timeframe entry triggers.
- Zone Invalidation: If a candle body closes completely entirely through an OB or FVG, that zone is usually considered invalidated/failed.
Zusammenfassung
AI summary
SMCIndicator is a trading indicator that analyzes raw price action data—Open, High, Low, Close—and historical volatility to identify Smart Money Concepts (SMC) such as market structure shifts and key price zones. It detects swing points by comparing current candles to surrounding bars, monitors market structure through break of previous highs or lows, and calculates momentum using Average True Range (ATR) to highlight imbalances.
The indicator visually marks market structure lines: Break of Structure (BoS) for trend continuation and Change of Character (CHoCH) for potential reversals. It highlights Order Blocks (OB) and Fair Value Gaps (FVG) as colored zones representing origins of moves or price imbalances. Zones are considered mitigated once price tests them, which stops their horizontal extension.
Key adjustable parameters include fractal sensitivity for swing point detection, FVG ATR filter for gap strictness, mitigation extension for zone visibility after retests, and memory management to remove old zones.
Typical use cases involve identifying trend continuation setups by entering trades on pullbacks into bullish or bearish zones, and reversal setups by spotting CHoCH signals followed by price retesting relevant zones. The indicator suits price action and SMC traders across multiple timeframes, including day and swing trading. It requires confirmation after candle closes and should be combined with other analysis tools rather than used standalone.
The indicator visually marks market structure lines: Break of Structure (BoS) for trend continuation and Change of Character (CHoCH) for potential reversals. It highlights Order Blocks (OB) and Fair Value Gaps (FVG) as colored zones representing origins of moves or price imbalances. Zones are considered mitigated once price tests them, which stops their horizontal extension.
Key adjustable parameters include fractal sensitivity for swing point detection, FVG ATR filter for gap strictness, mitigation extension for zone visibility after retests, and memory management to remove old zones.
Typical use cases involve identifying trend continuation setups by entering trades on pullbacks into bullish or bearish zones, and reversal setups by spotting CHoCH signals followed by price retesting relevant zones. The indicator suits price action and SMC traders across multiple timeframes, including day and swing trading. It requires confirmation after candle closes and should be combined with other analysis tools rather than used standalone.
Indikatorprofil
Indikatorkategorie
Marktstruktur (SMC)
Ausgabetyp
Visualisierung
Datenanforderungen
Nur Balken
Unterstützte Signale
Wendepunkt
Trendstärke
Level – Durchbrechen
Level – Berührung
Kundenbewertungen
0.0
Bewertungen: 0
Kundenbewertungen
Bisher gibt es keine Bewertungen für dieses Produkt. Haben Sie es schon ausprobiert? Dann können Sie die erste Person sein, die andere darüber informiert!
Diskussion
Häufig gestellte Fragen (FAQ)
Fair Value Gap
BOS
Order Block
CHOCH
Market Structure
Über den cTrader Store verfügbare Produkte, einschließlich Handelsbots, Indikatoren und Plugins, werden von externen Entwicklern bereitgestellt und nur zu Informations- und technischen Zugriffszwecken verfügbar gemacht. cTrader Store ist kein Broker und erbringt keine Anlageberatung, persönlichen Empfehlungen oder eine Garantie für zukünftige Performance.
Mehr von diesem Autor



















Preis
Seit 13/05/2026
1
Kostenlose Installationen