

คำอธิบาย
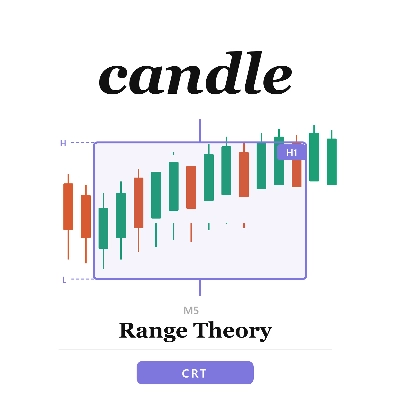
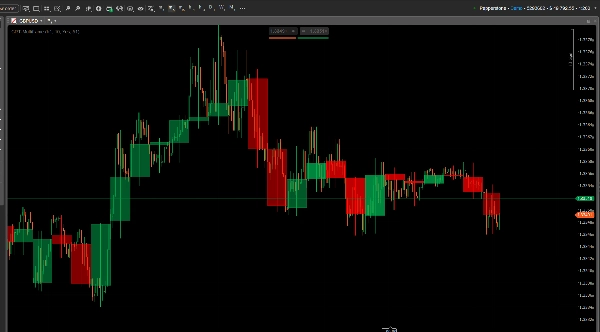
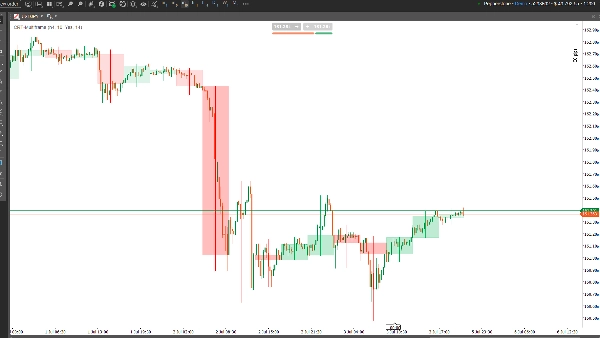
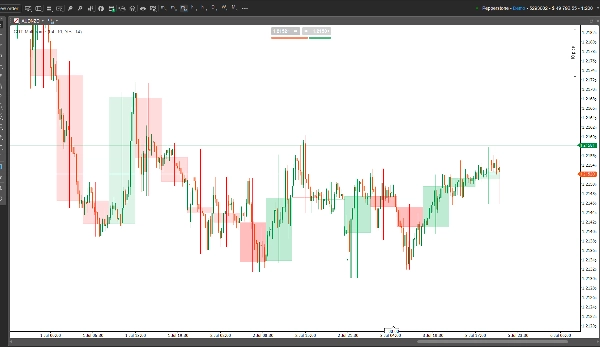
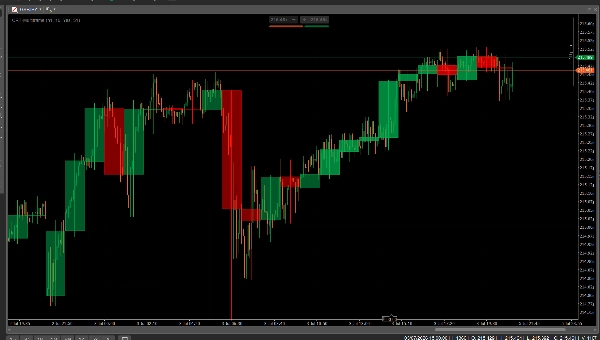
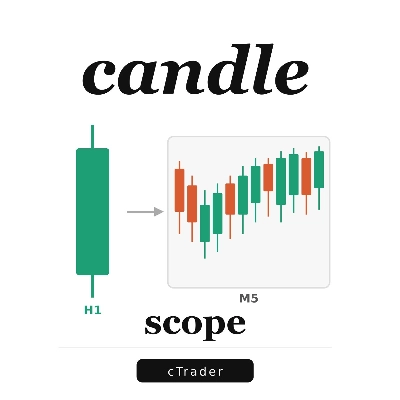
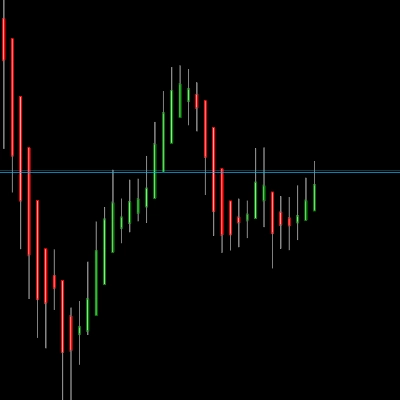
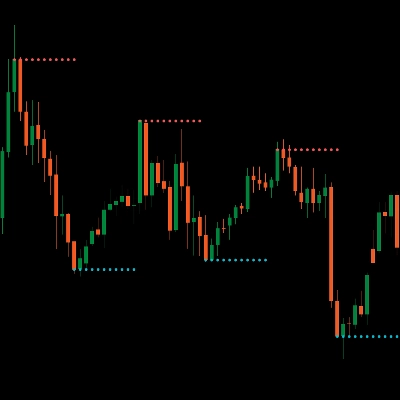
CRT_MTF_Candles — Visual overlay of higher timeframe candles on the current chart.
- Fetches OHLC data from the selected higher timeframe (Minute1 to Monthly) via MarketData.GetBars()
- Draws each HTF candle body as a time-positioned filled rectangle (Chart.DrawRectangle with DateTime) Getting started
- Draws the wick/shadow as a vertical trend line at the candle's midpoint using bar index (Chart.DrawTrendLine)
- Completed candles: drawn once when they close, stored in a list, never updated again OpenCode includes free models
- Current candle (optional): deleted and redrawn on each new tick/bar to reflect live price so you can start immediately.
- Max candle count limit (1-30), removing oldest candles when exceeded
- Auto-hides when the chart timeframe equals or exceeds the selected HTF Connect from 75+ providers to
- Configurable: bullish/bearish color, body opacity, candle count, include/exclude current candle
สรุป
การสนทนา
รีวิวจากลูกค้า
คำถามที่พบบ่อย
เพิ่มเติมจากผู้เขียนคนนี้






ราคา