

Beschreibung
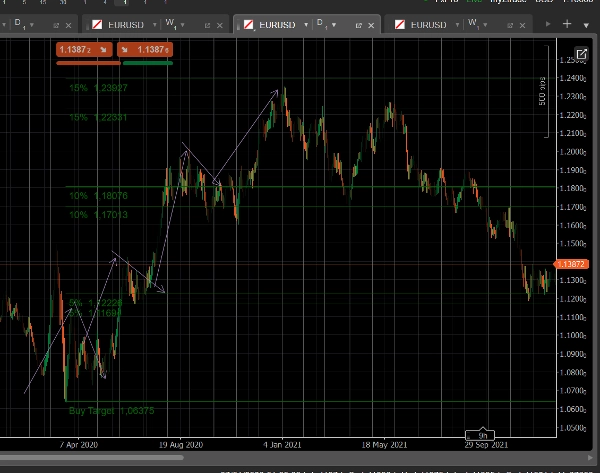
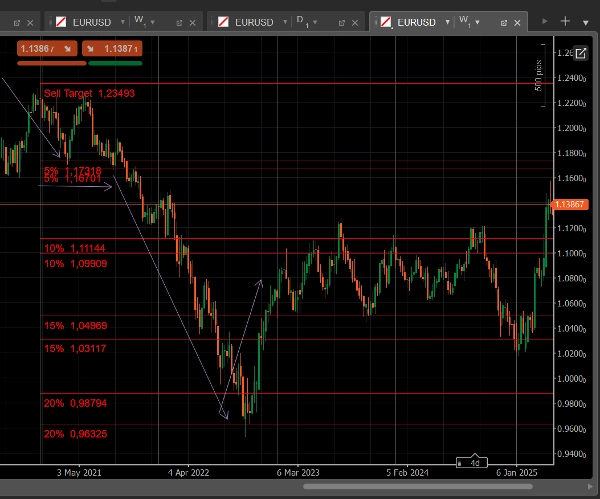
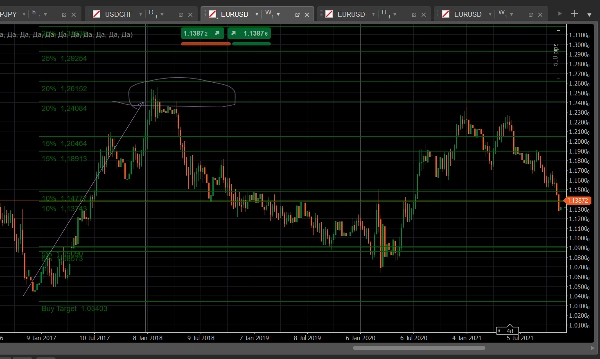
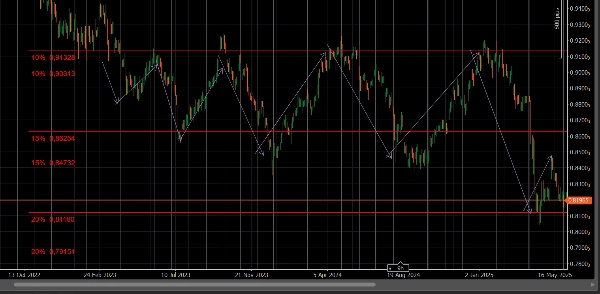
MyZtrade MM Levels erstellt Preiszonen aus den genauen Punkten, an denen der Market Maker den Preis dreht: den Hochs und Tiefs bedeutender Schwünge. Anstatt vollständig automatische Zonen zu verwenden, wählen Sie selbst das Extrem aus – der Indikator projiziert dann potenzielle Umkehr- und Korrekturzonen direkt daraus.
So funktioniert es:
- Klicken Sie in die Nähe des Hochs oder Tiefs der Kerze, von der Sie Zonen erstellen möchten.
- Drücken Sie Q, um von diesem Punkt aus eine breite Menge an Zonen zu erstellen.
- Drücken Sie W, um von demselben Punkt aus eine feinere, präzisere Menge an Zonen zu erstellen.
- Jede Zone ist mit ihrem genauen Preis beschriftet – keine manuelle Berechnung nötig.
Warum es hilft:
- Visualisiert sofort, wie weit eine Korrektur oder Umkehr von einem Schlüsselhoch/-tief reichen könnte, ohne dass Sie selbst rechnen müssen.
- Zwei unabhängige Zonensätze – einer für eine schnelle Chartübersicht, einer für präzise Kartierung.
- Jede Zone kann einzeln ein- oder ausgeschaltet werden, sodass Ihr Chart nur das zeigt, was Sie benötigen.
Für einen sauberen Workflow entwickelt:
- Gruppenlöschung: Entfernen Sie eine Linie aus einem Zonensatz (Kaufen oder Verkaufen) und der gesamte Satz verschwindet auf einmal – keine manuelle Chartbereinigung.
- Konfigurierbarer Linienstil (gestrichelt/durchgezogen) und separate Farben für Kauf- und Verkaufszonen.
- Optionale gepaarte Linien für Trader, die mit Bereichen statt einzelnen Preispunkten arbeiten.
Für wen es gedacht ist: Trader, die von Schlüsselhochs und -tiefs ausgehen und potenzielle Umkehr- oder Korrekturzonen schnell abbilden möchten, ohne zum Taschenrechner greifen zu müssen.
Zusammenfassung
AI summary
MyZtrade MM Levels v1.2 is a trading indicator designed to identify potential market maker reversal and correction zones based on key price extremes. Users manually select a significant high or low on the chart, then generate price zones projecting where corrections or reversals may occur. The indicator offers two zone sets: a broad set for quick analysis (activated by pressing Q) and a finer, more precise set (activated by pressing W). Each zone is clearly labeled with its exact price level, eliminating the need for manual calculations.
Key features include individual toggling of zones for customized chart views, group deletion of entire zone sets for efficient cleanup, configurable line styles and colors distinguishing Buy and Sell zones, and optional paired lines for range-based trading. The tool supports analysis based on classical support and resistance concepts and integrates elements related to Fibonacci, order blocks, supply and demand, liquidity grabs, and premium/discount zones.
MyZtrade MM Levels is intended for traders who focus on key highs and lows to quickly map potential reversal or correction areas without additional calculations, facilitating a streamlined workflow and enhanced chart clarity.
Key features include individual toggling of zones for customized chart views, group deletion of entire zone sets for efficient cleanup, configurable line styles and colors distinguishing Buy and Sell zones, and optional paired lines for range-based trading. The tool supports analysis based on classical support and resistance concepts and integrates elements related to Fibonacci, order blocks, supply and demand, liquidity grabs, and premium/discount zones.
MyZtrade MM Levels is intended for traders who focus on key highs and lows to quickly map potential reversal or correction areas without additional calculations, facilitating a streamlined workflow and enhanced chart clarity.
Indikatorprofil
Indikatorkategorie
Unterstützung und Widerstand
Ausgabetyp
Visualisierung
Datenanforderungen
Nur Balken
Unterstützte Signale
Ausbruch
Wendepunkt
Level – Berührung
Level – Durchbrechen
Kundenbewertungen
0.0
Bewertungen: 0
Kundenbewertungen
Bisher gibt es keine Bewertungen für dieses Produkt. Haben Sie es schon ausprobiert? Dann können Sie die erste Person sein, die andere darüber informiert!
Diskussion
Häufig gestellte Fragen (FAQ)
Fibonacci
Premium/Discount
Order Block
Supply & Demand
Channel
Liquidity Grab
Support & Resistance
Über den cTrader Store verfügbare Produkte, einschließlich Handelsbots, Indikatoren und Plugins, werden von externen Entwicklern bereitgestellt und nur zu Informations- und technischen Zugriffszwecken verfügbar gemacht. cTrader Store ist kein Broker und erbringt keine Anlageberatung, persönlichen Empfehlungen oder eine Garantie für zukünftige Performance.
Mehr von diesem Autor





![„[Stellar Strategies] Inside Bar with Signals“-Logo](https://cdn.ctrader.com/image/webp/1d9e8bfa-3b2c-4440-bb37-5856902008a7_30683)















Preis

Seit 28/06/2025